RHIhub - Data Visualization Style Guide
- A Graphicacy project (my role: design and writing)
- Tools used: Adobe Illustrator, InDesign
Content Highlights
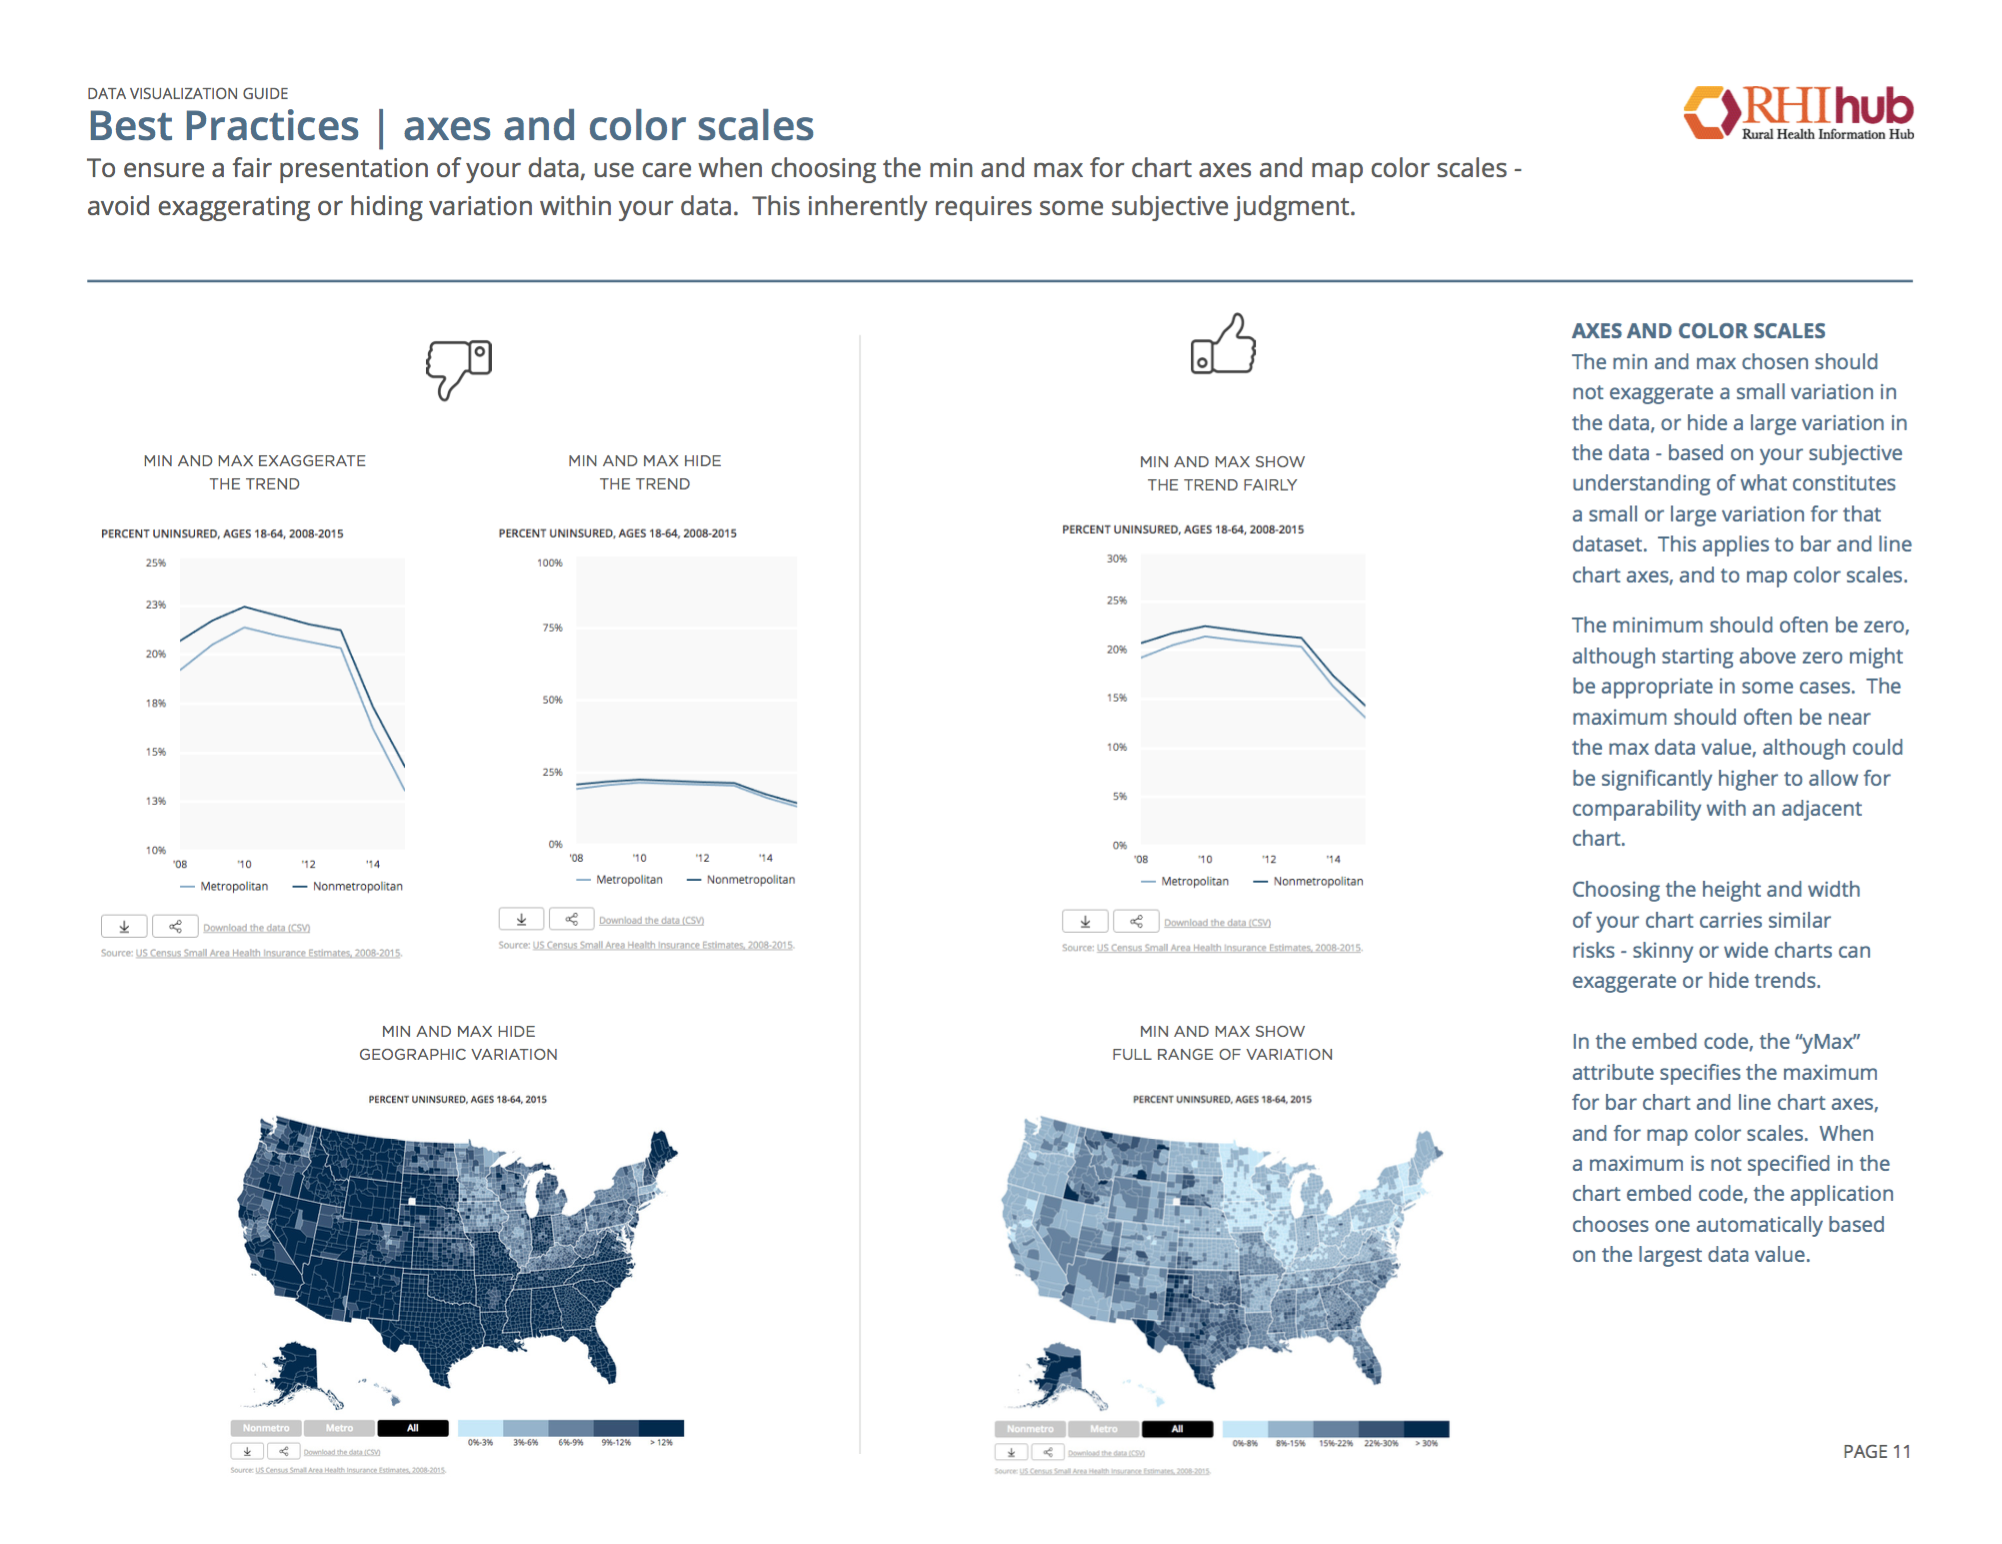
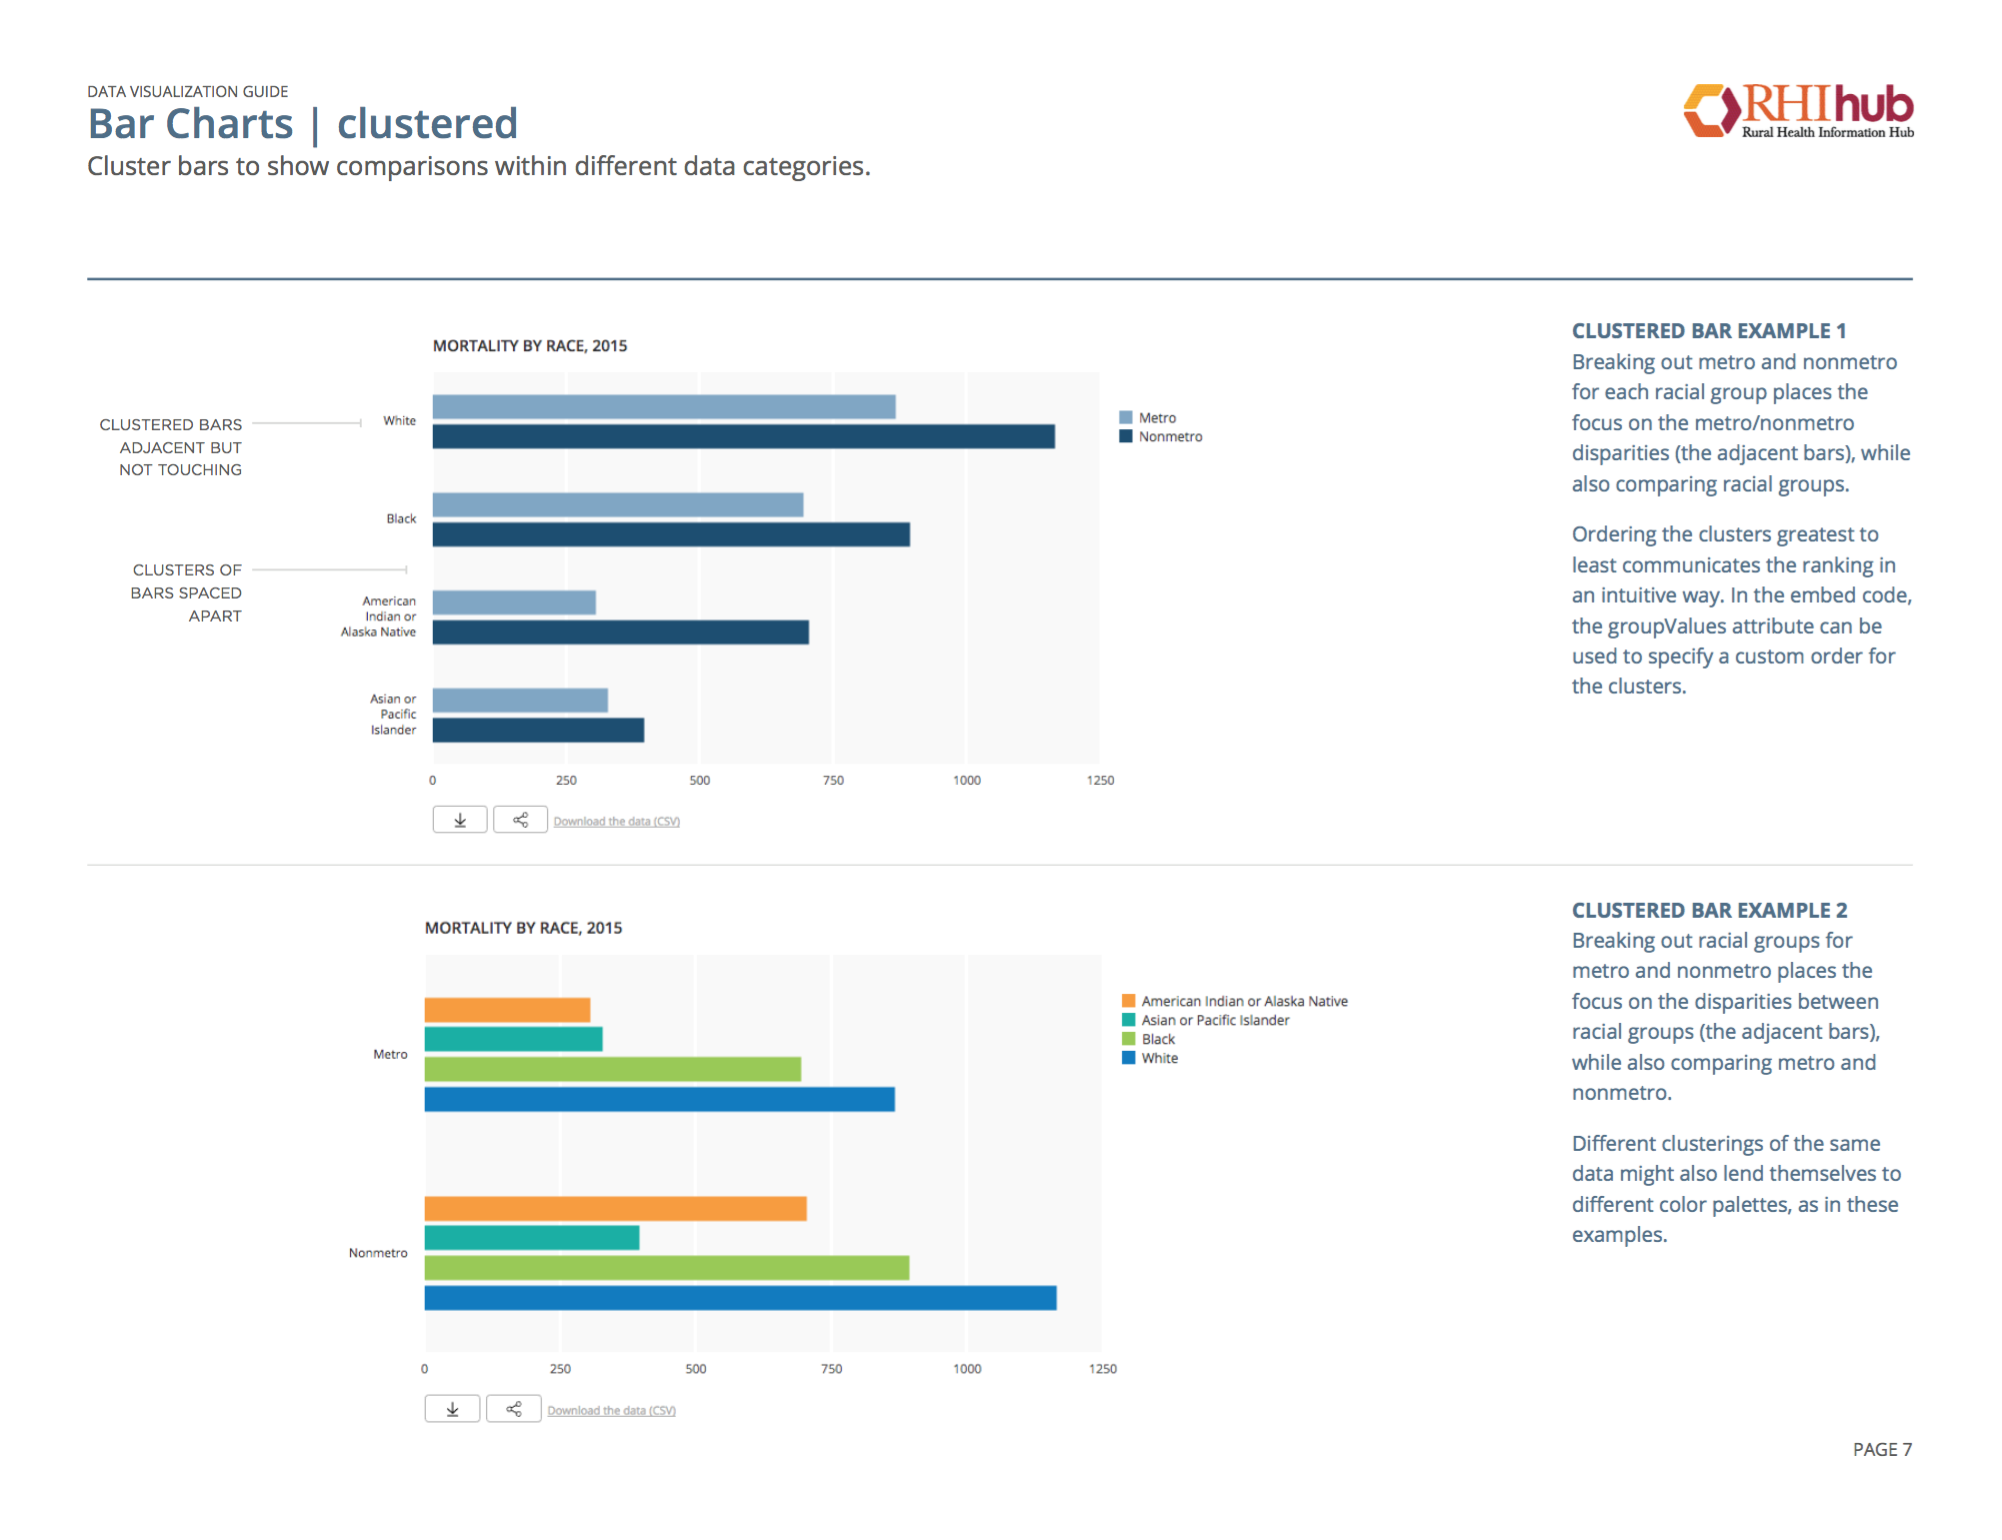
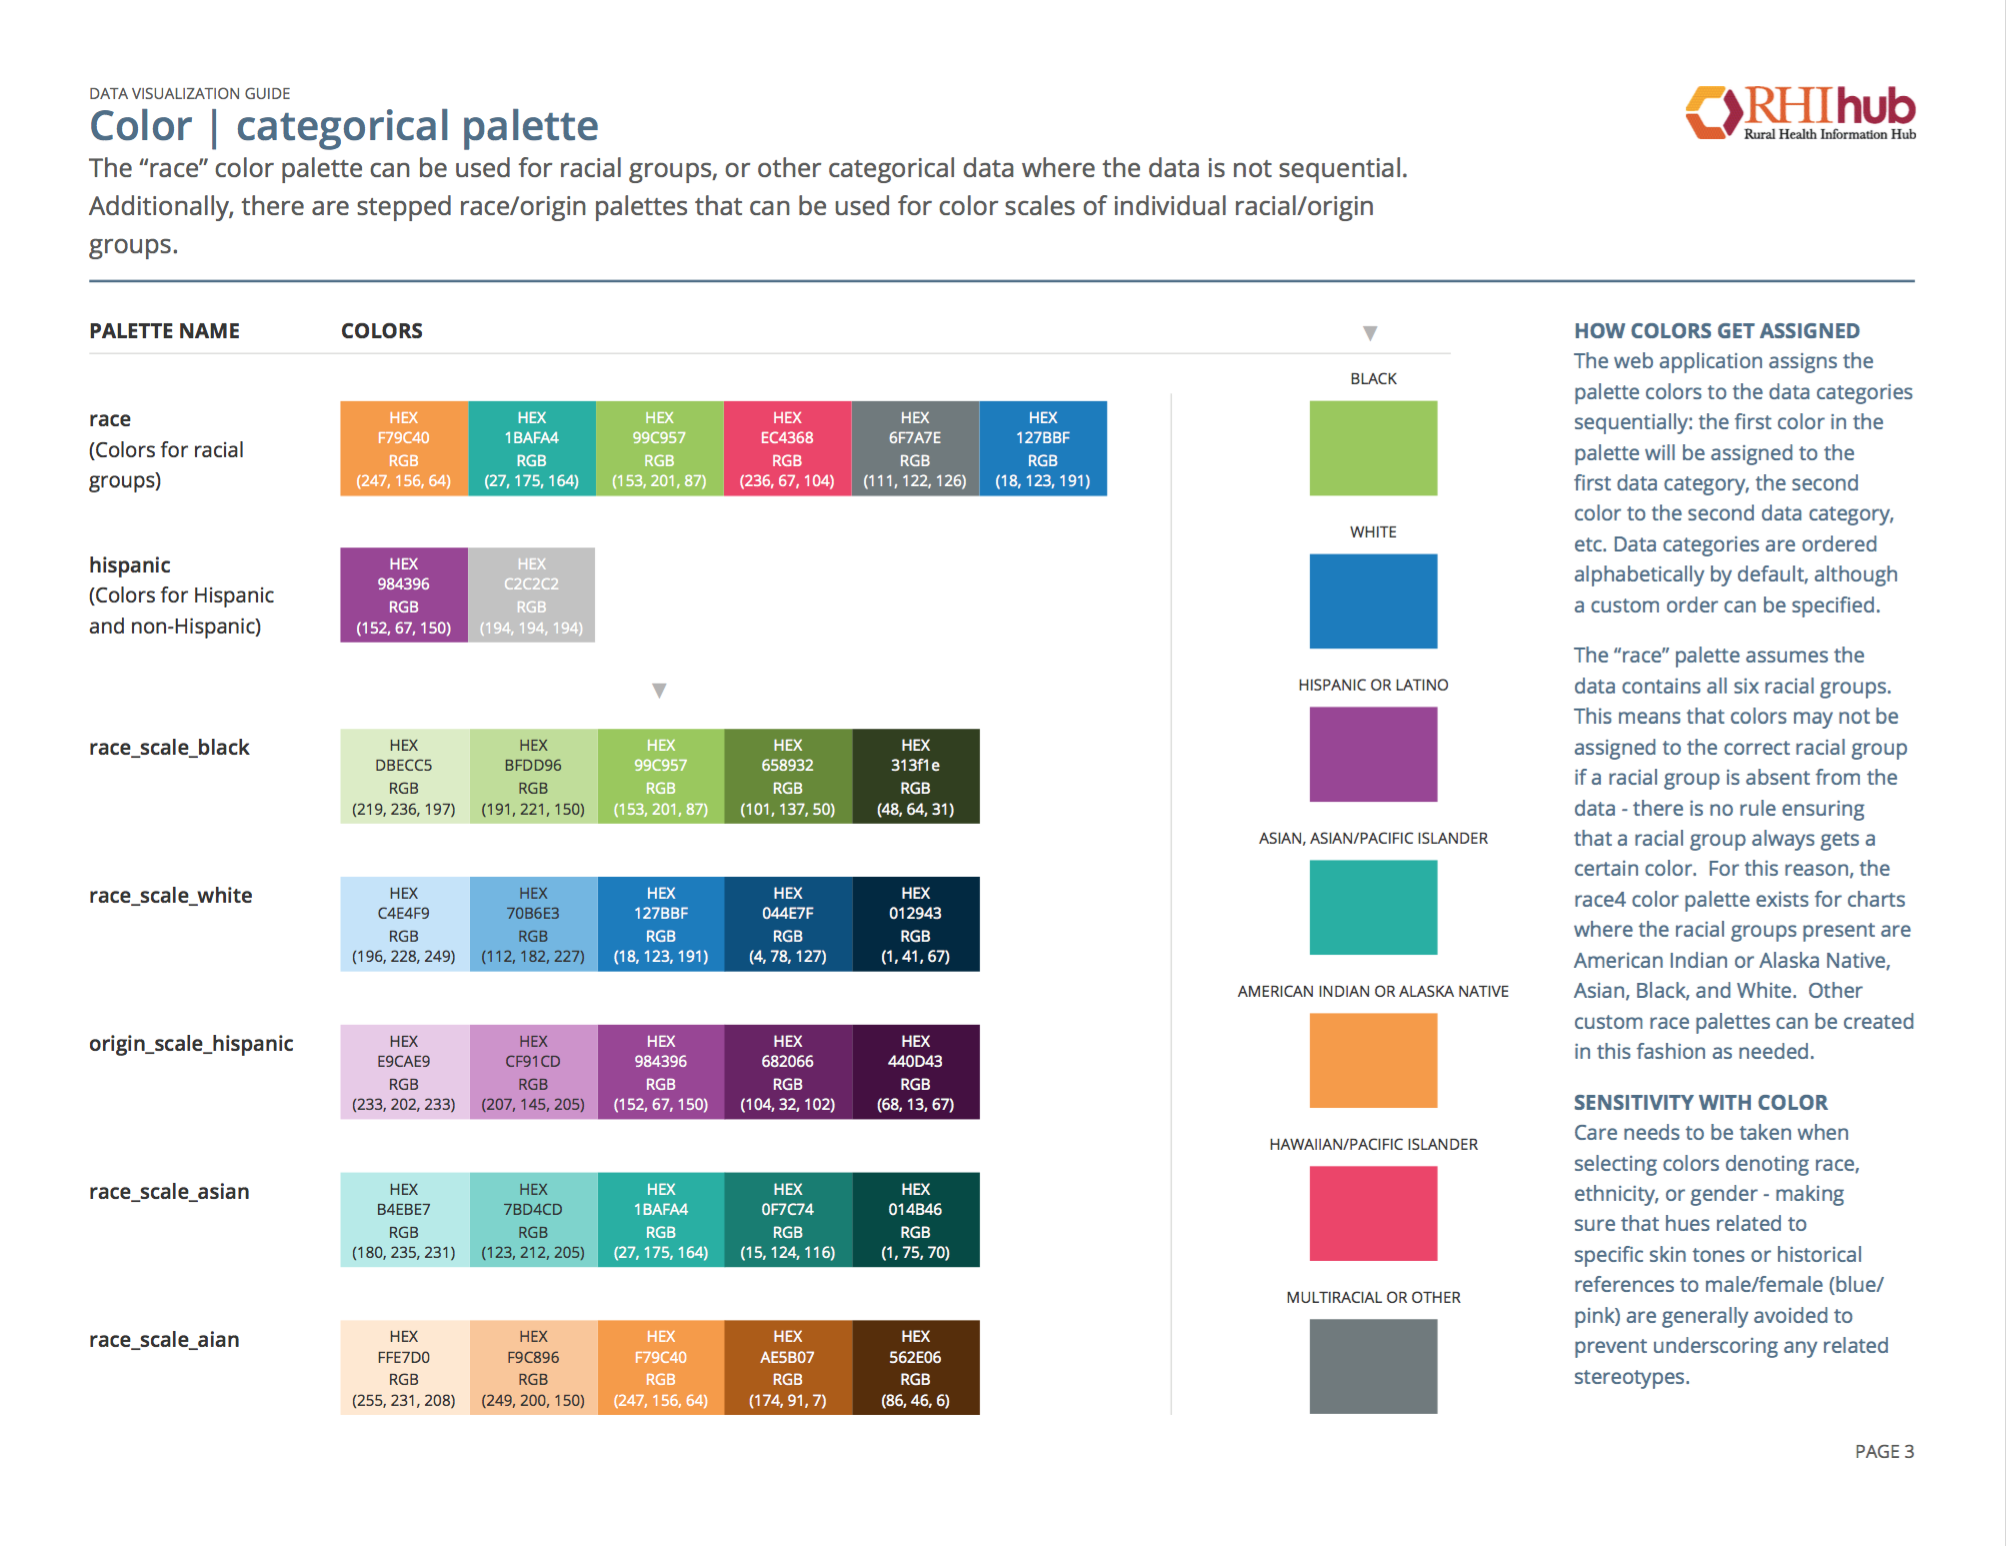
Given the client's desire to build internal standards around data visualization, I suggested a style guide to accompany the interactive visualizations we built for them (launched in 2018). Using the Urban Institute Data Visualization Style Guide as a model, I wrote a guide on how to create consistent and effective visualizations using the chart library we built.


