Advomatic / Anti-Defamation League - Hate Crime Map
- A Graphicacy project (my role: design, project management)
- Tools used: Sketch, Tableau, Excel
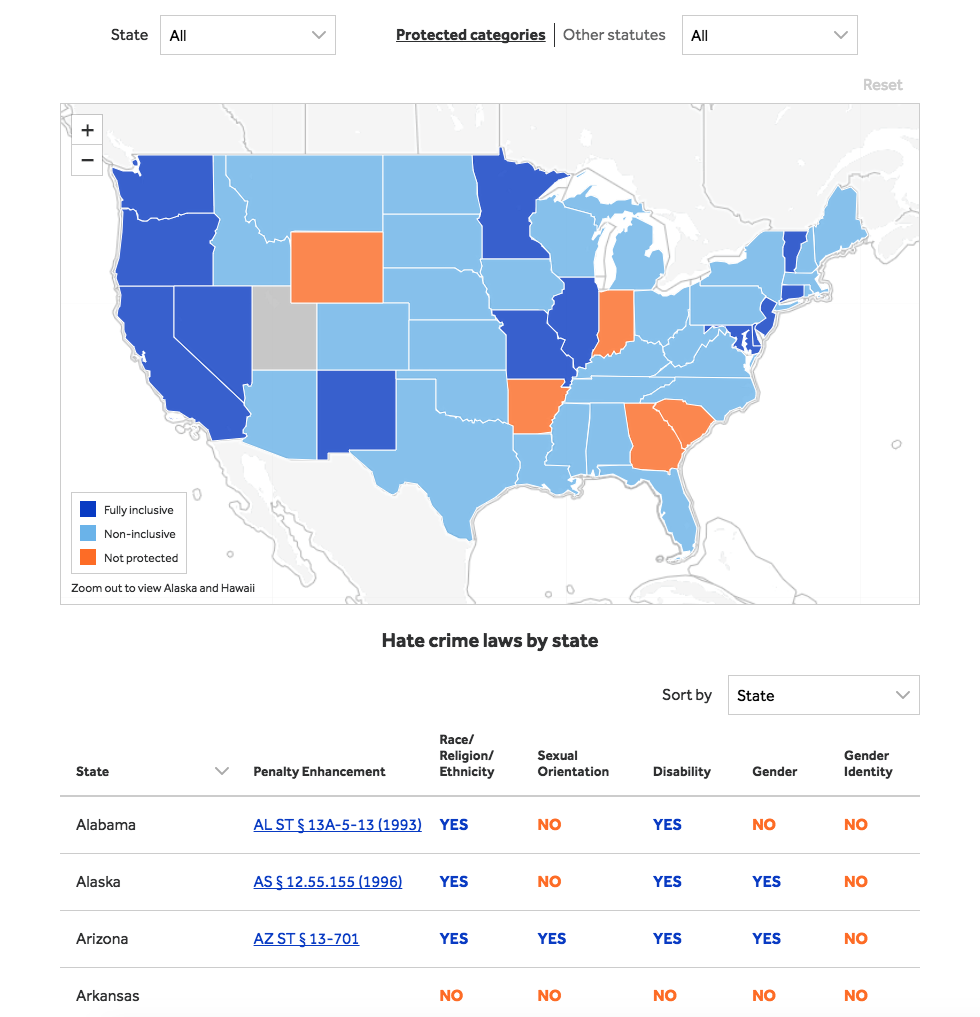
The Hate Crime Map highlights states and cities that are not doing enough to prevent hate crimes, allowing the user to explore different types of statutes. Working with a tight timeline, I created a design that reflected the complexity of the data and was doable within the schedule.

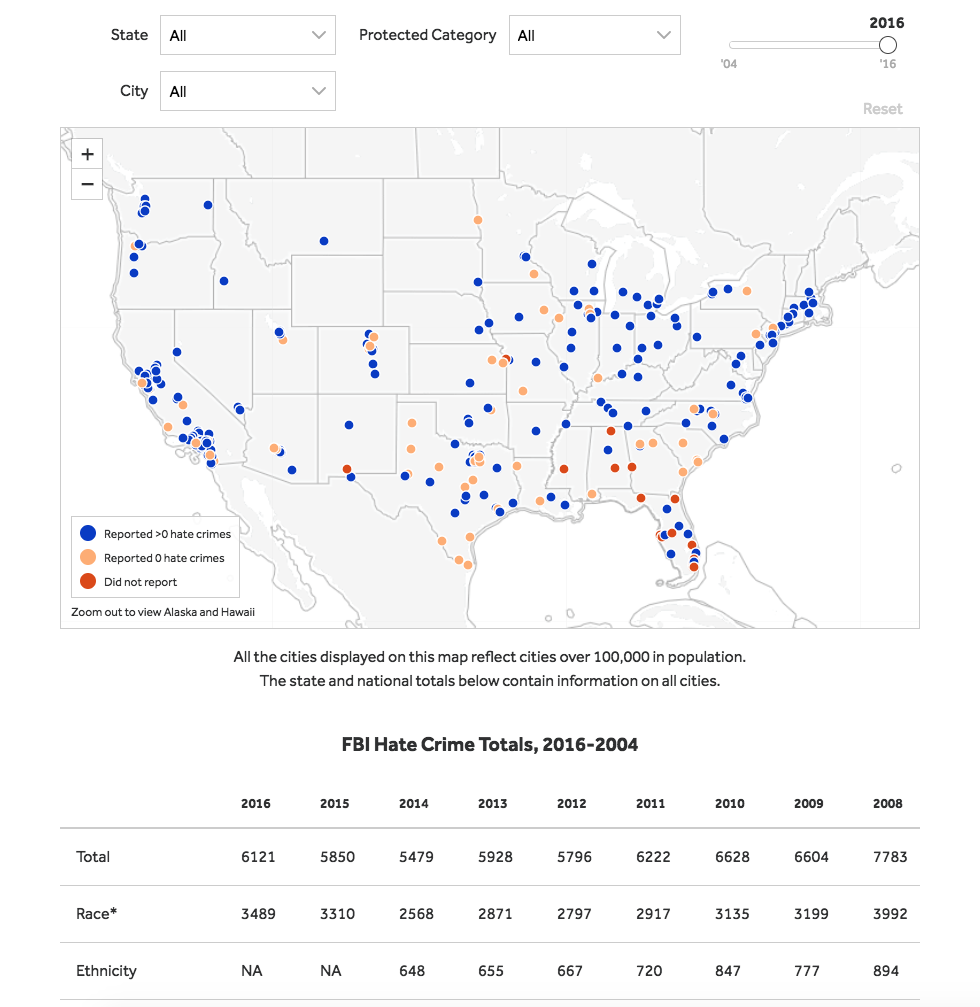
One key question was how to highlight the issue of underreporting. Counterintuitively, the cities that report the most hate crimes are not the problem areas - the map was designed to call attention to large cities that did not report, or reported zero hate crimes. The coloring of city dots reflects this.

Mobile was the top priority, and the responsive design ensures that all features are available at all screen sizes. On smaller screens, the table columns become rows in order to fit in a readable way.
