Ipsos Public Affairs - 2018 Political Atlas
- A Graphicacy project (my role: design, project management)
- Tools used: Sketch, Excel
The 2018 Political Atlas was a collaboration with Ipsos, a multinational polling company, to showcase their and their partners' data related to the midterm elections. Working with a very tight timeline, we designed, built, and thoroughly tested a website that houses a large amount of data and uses several different visualization presentations. The site was featured in major media outlets and seen by tens of thousands of users, with an average session duration of 4 minutes.
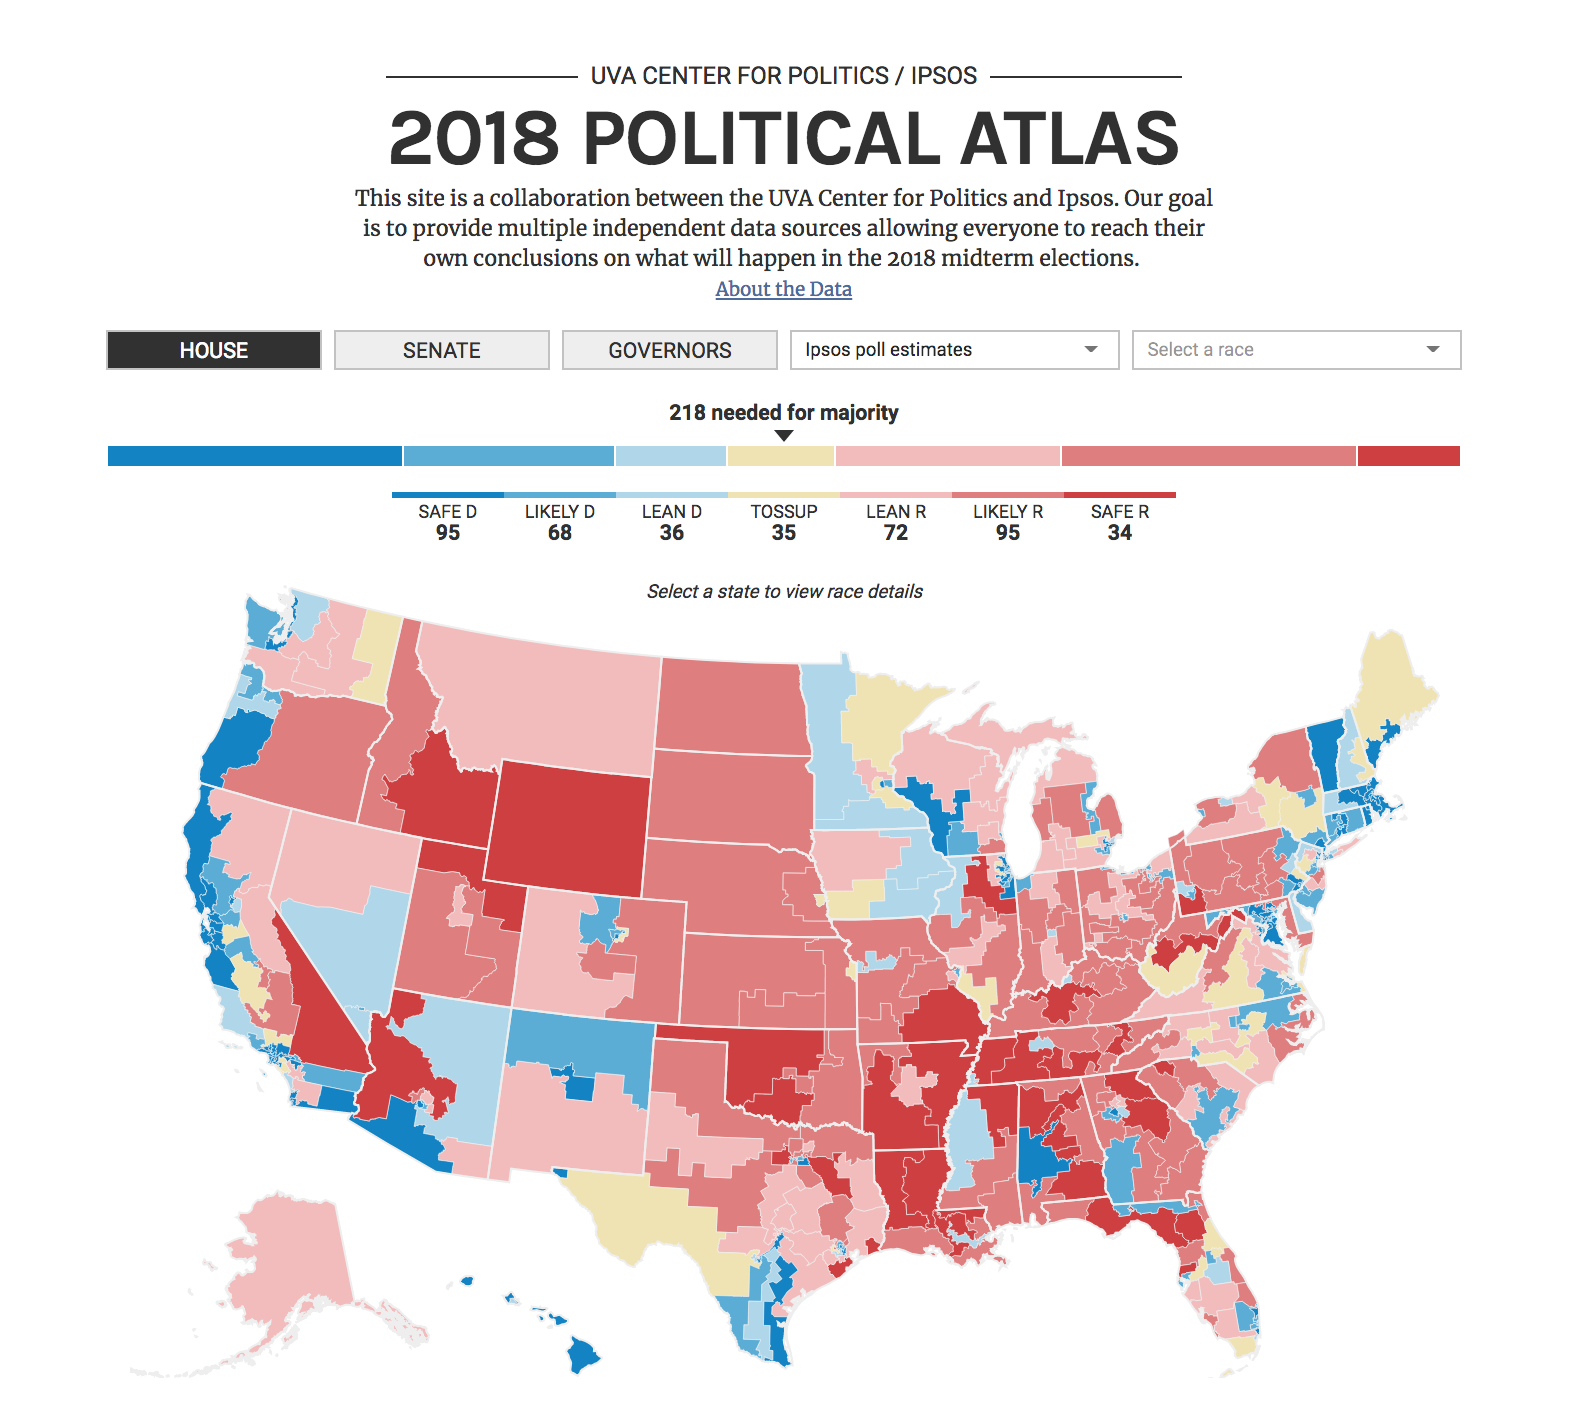
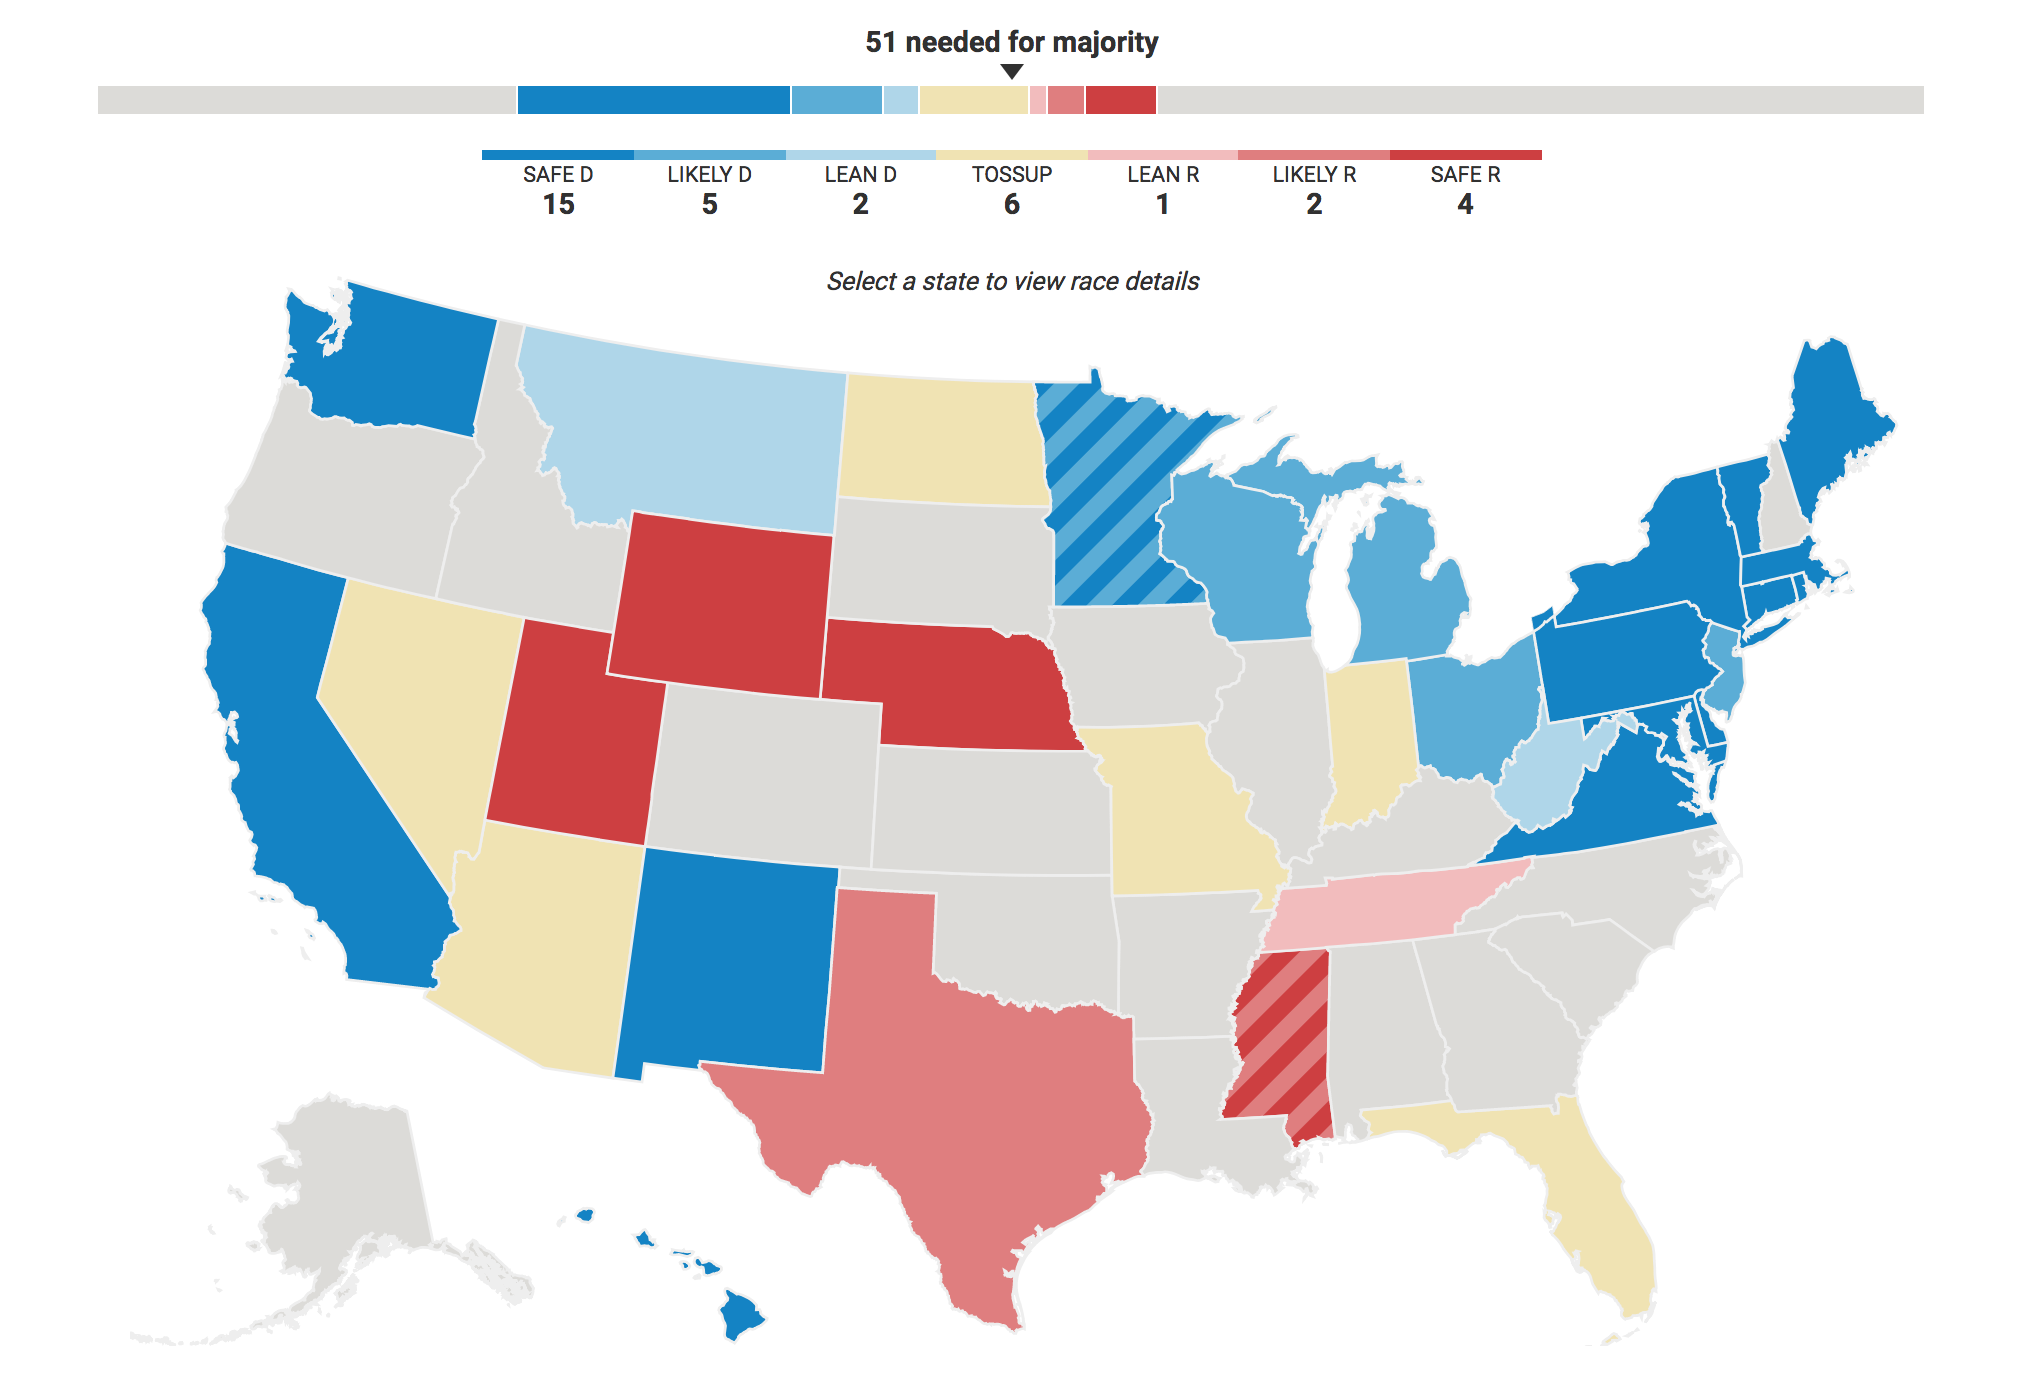
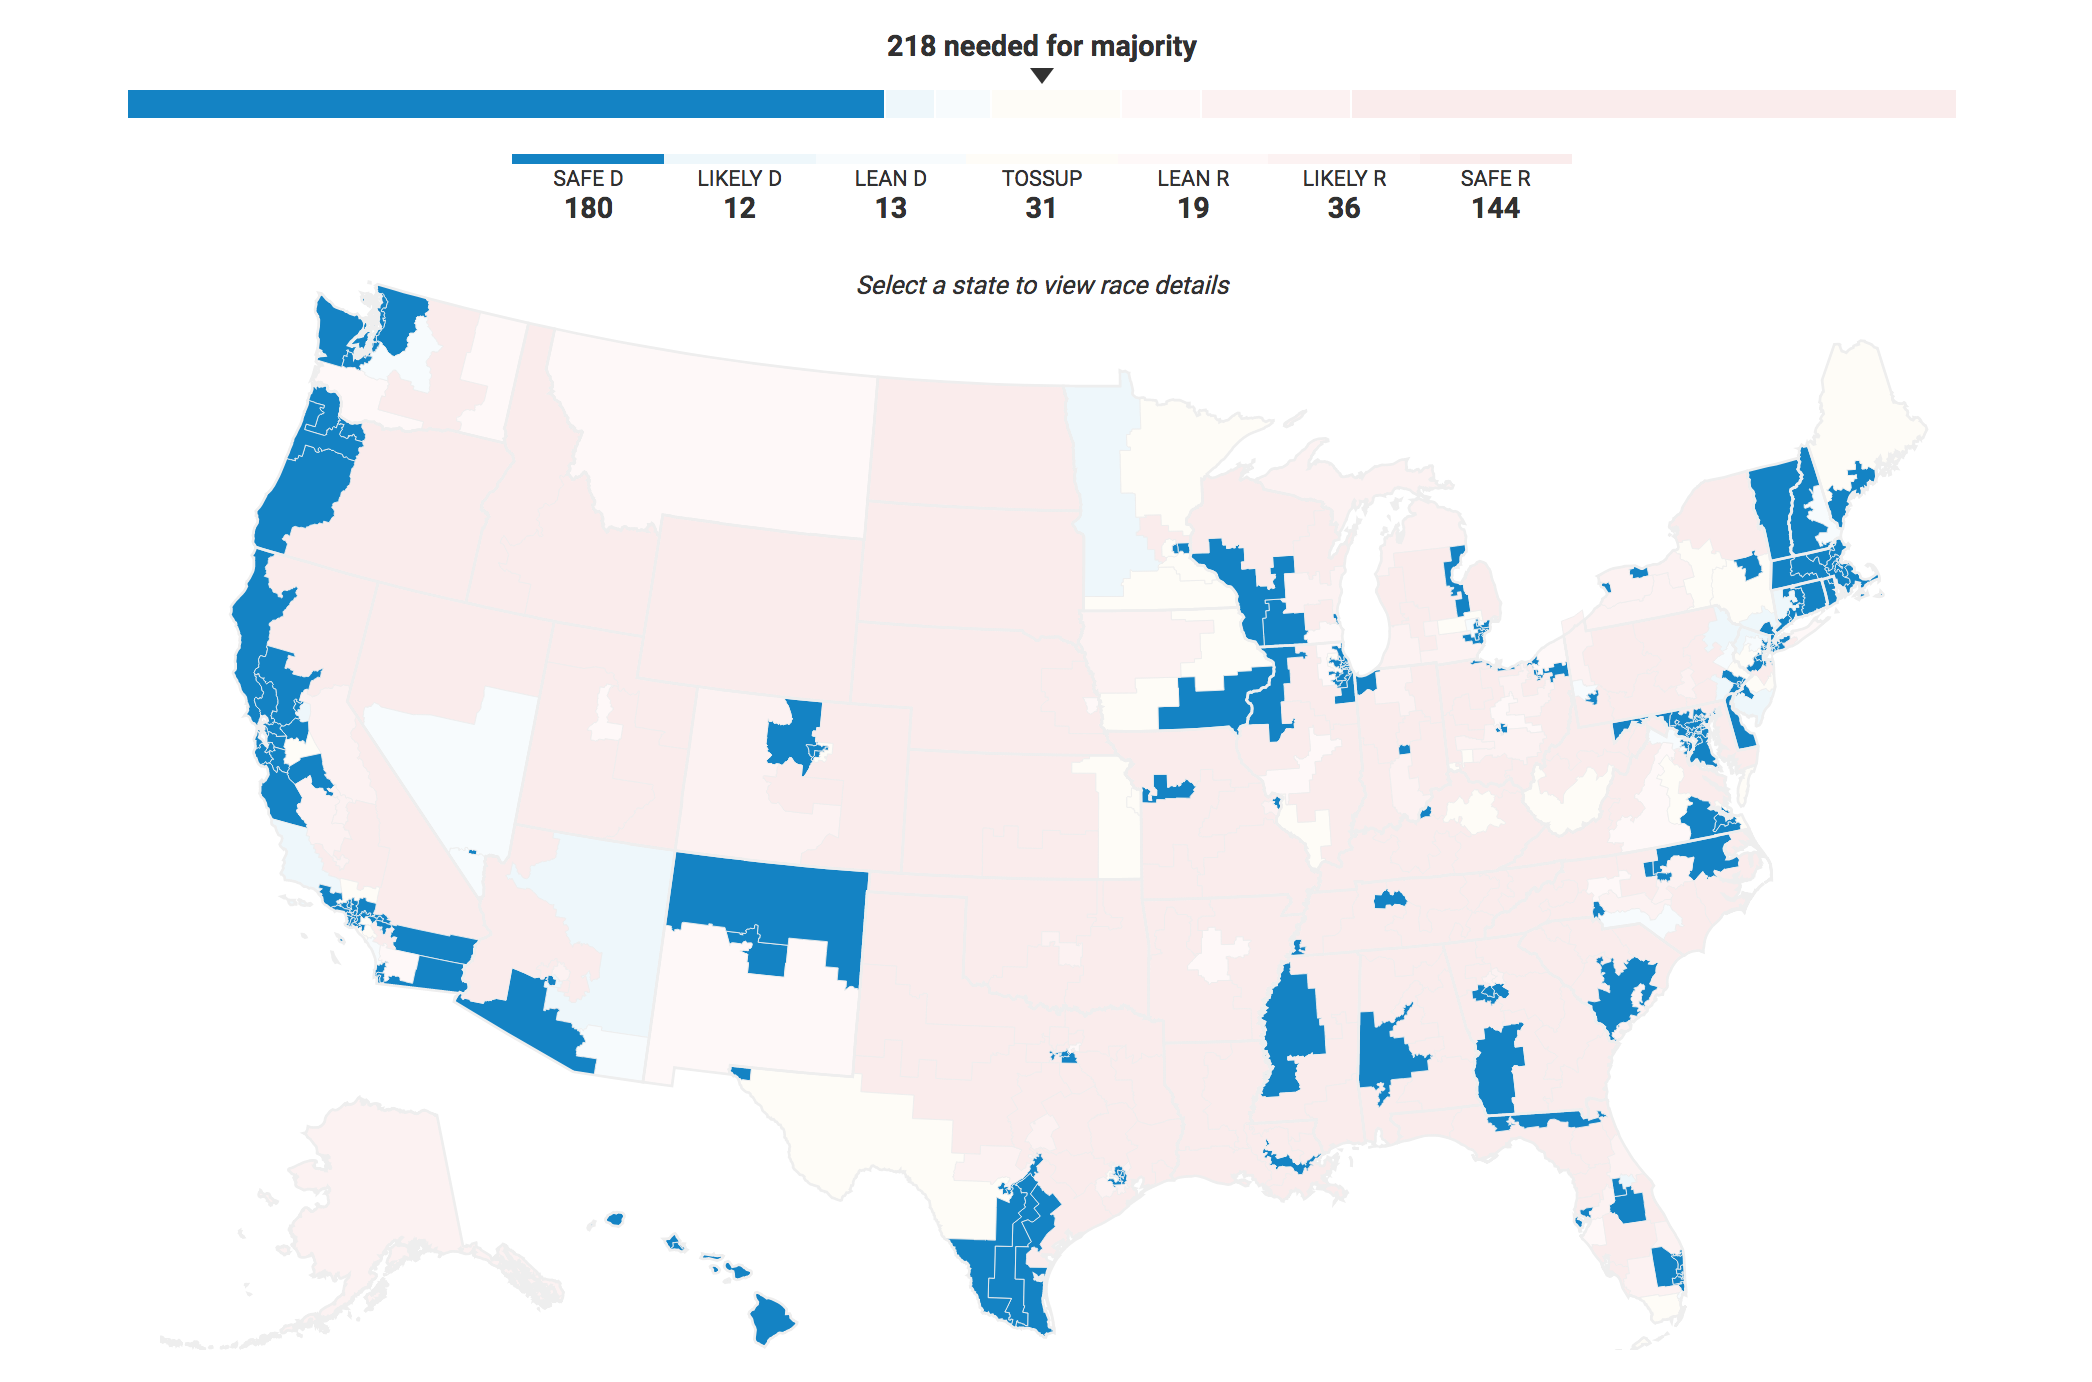
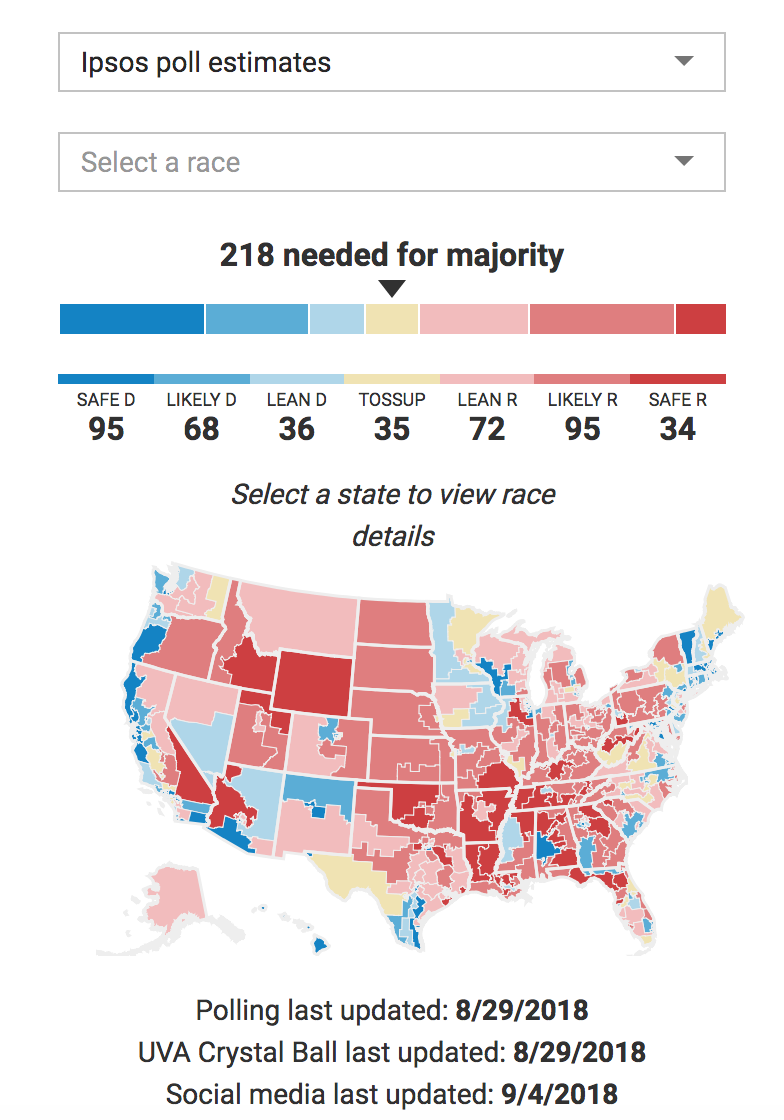
The homepage allows the user to switch between different metrics when viewing race predictions for House, Senate, and gubernatorial races, with the visualization taking into account the nuances and exceptions in each view.
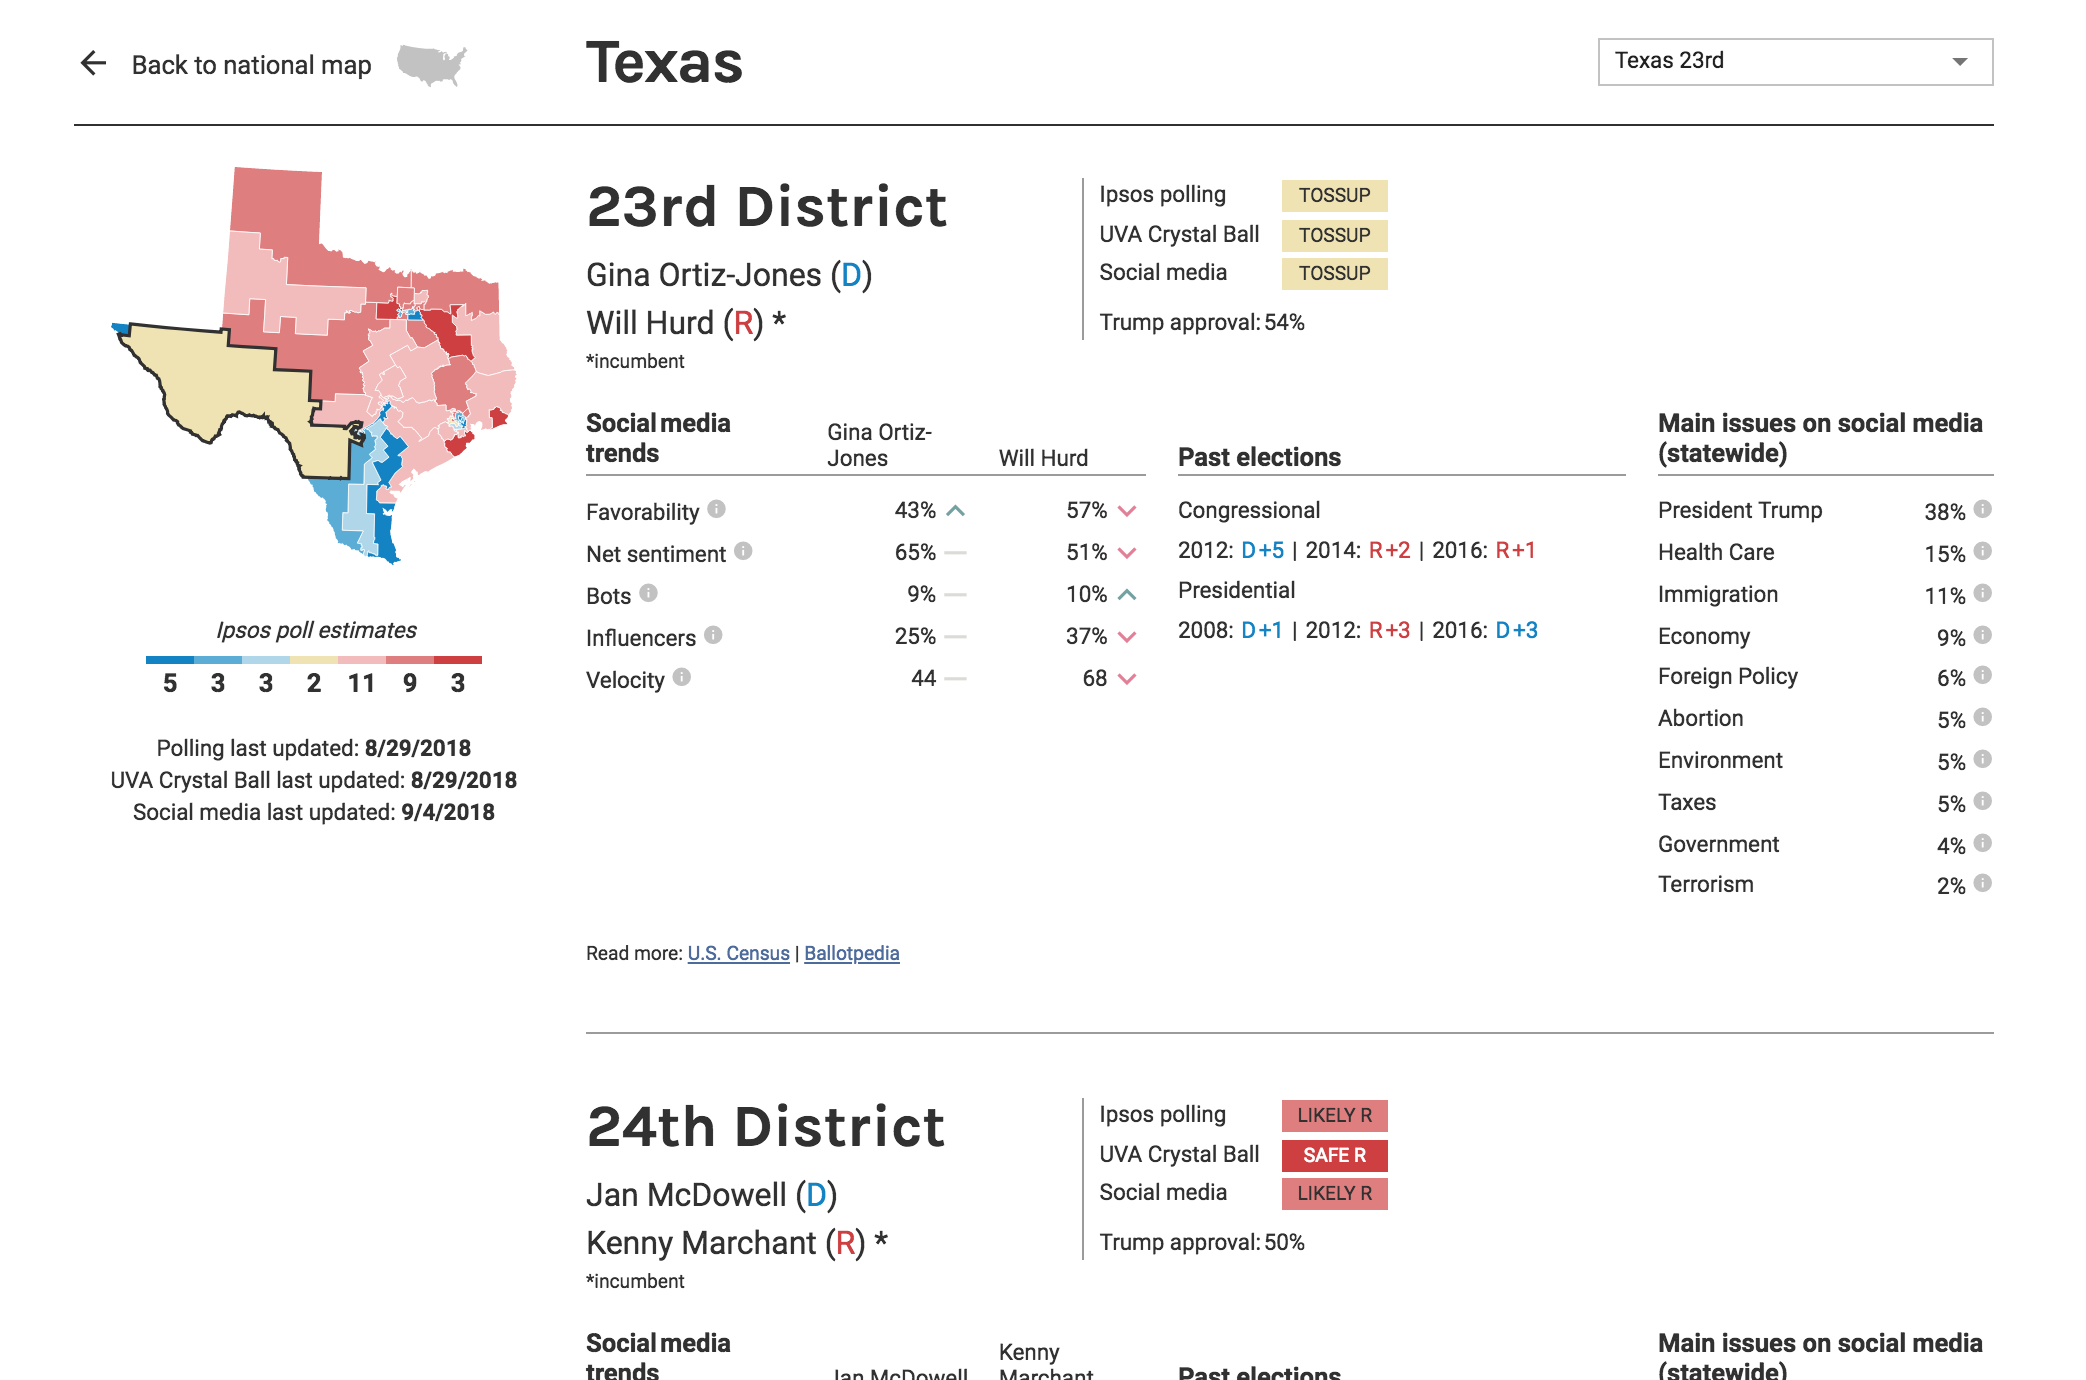
The user can select a state of interest to view detailed information about races in that state.
The map, legend, and bar chart are linked to allow users to explore subsets of the data on hover.
The layout resizes responsively, and is optimized for desktop and iPad.
The current site can be seen here, although the design has been updated since I worked on it: https://www.political-atlas.com.