How Anti-Immigrant Political Parties Are Evolving
- Project for Independent Study in Data Journalism, fall 2020
- Tools used: D3.js, R
Design
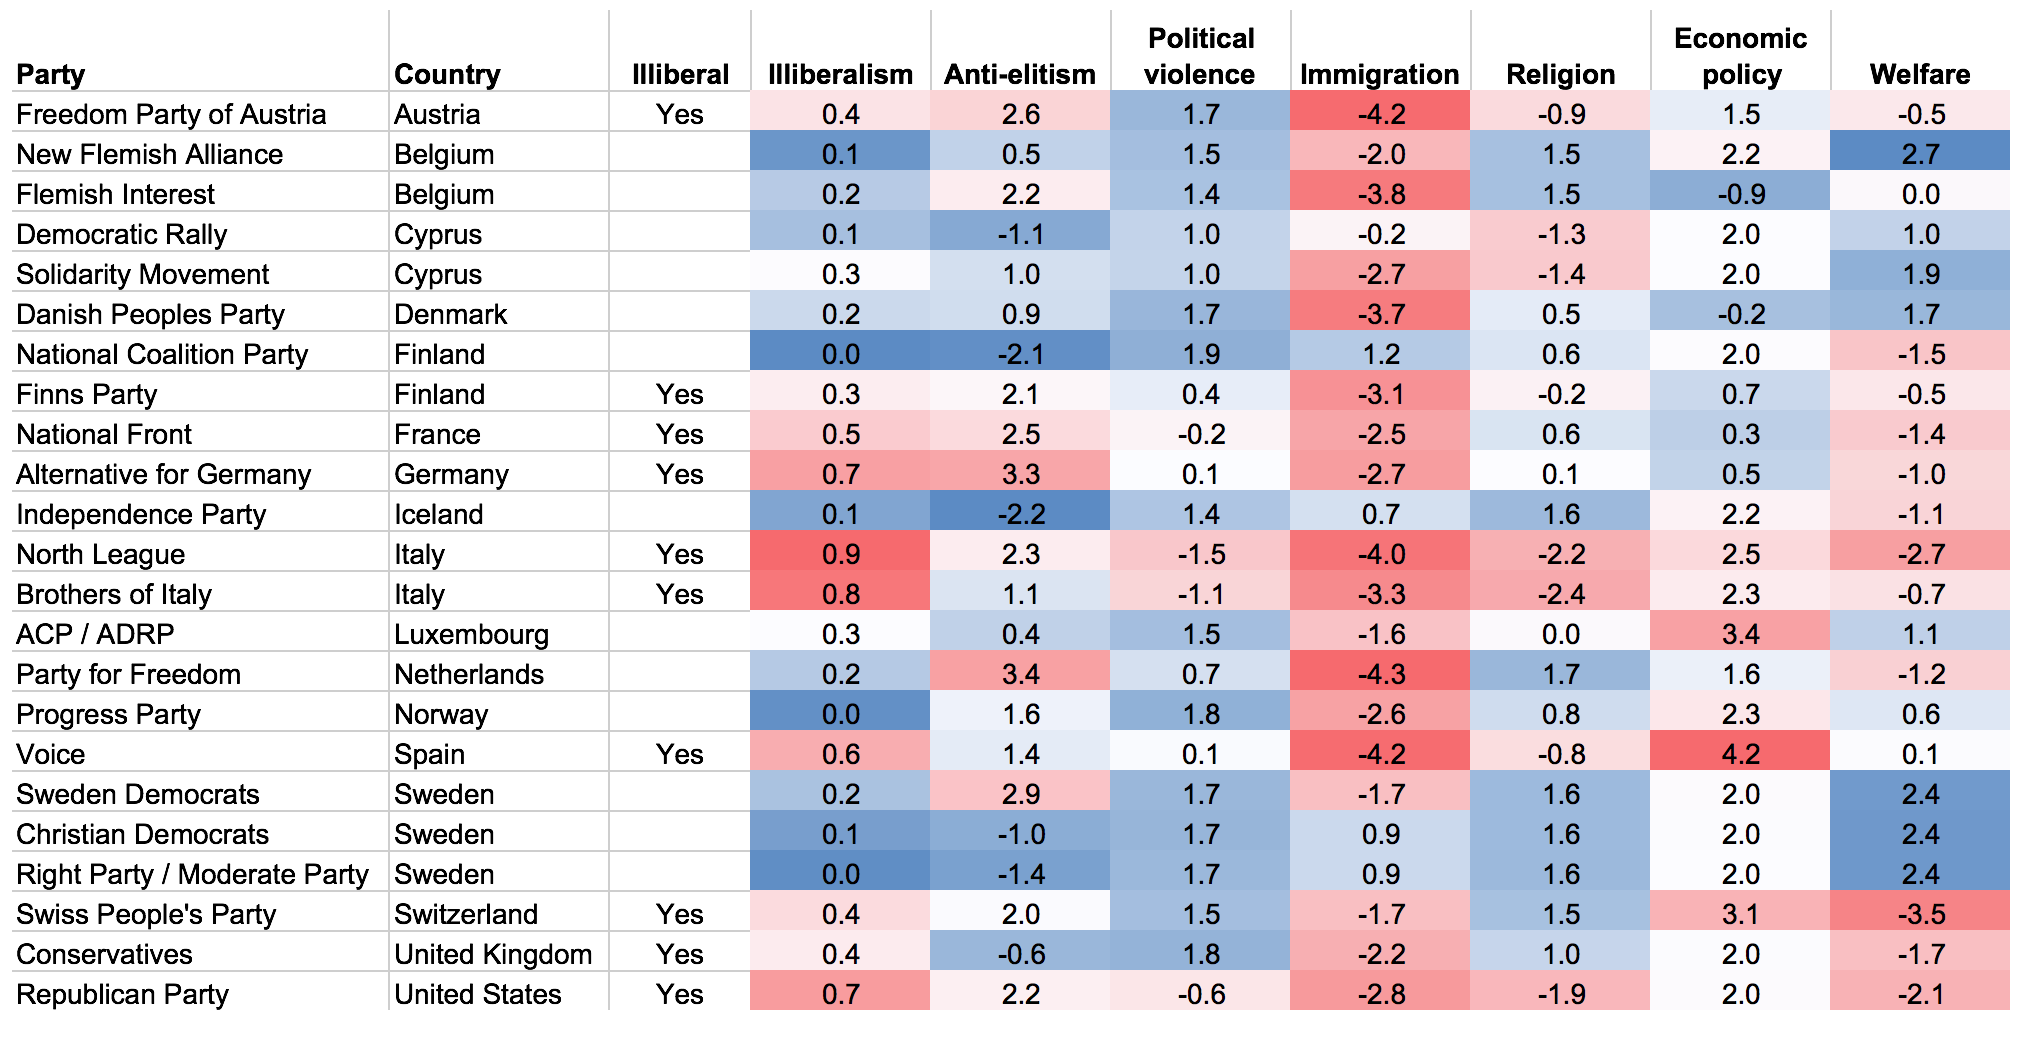
This scrollytelling project began with finding an amazing new dataset from the V-Dem Institute on political parties' ideologies and attitudes toward democracy. After exploring different data stories, I decided to present an overview of anti-immigration parties in western Europe and the U.S. and how they are changing.
I created the visualizations in D3 and used the graph-scroll.js library to implement a scrollytelling approach. As the user scrolls, the visualization transitions to a new version, and narrative text highlights the main points and provides context.
To keep users’ attention, I wanted to start with a simple visualization and then add complexity. After identifying the anti-immigration parties, the narrative introduces additional variables one at a time, showing change over time and then positions on the economy and democracy.
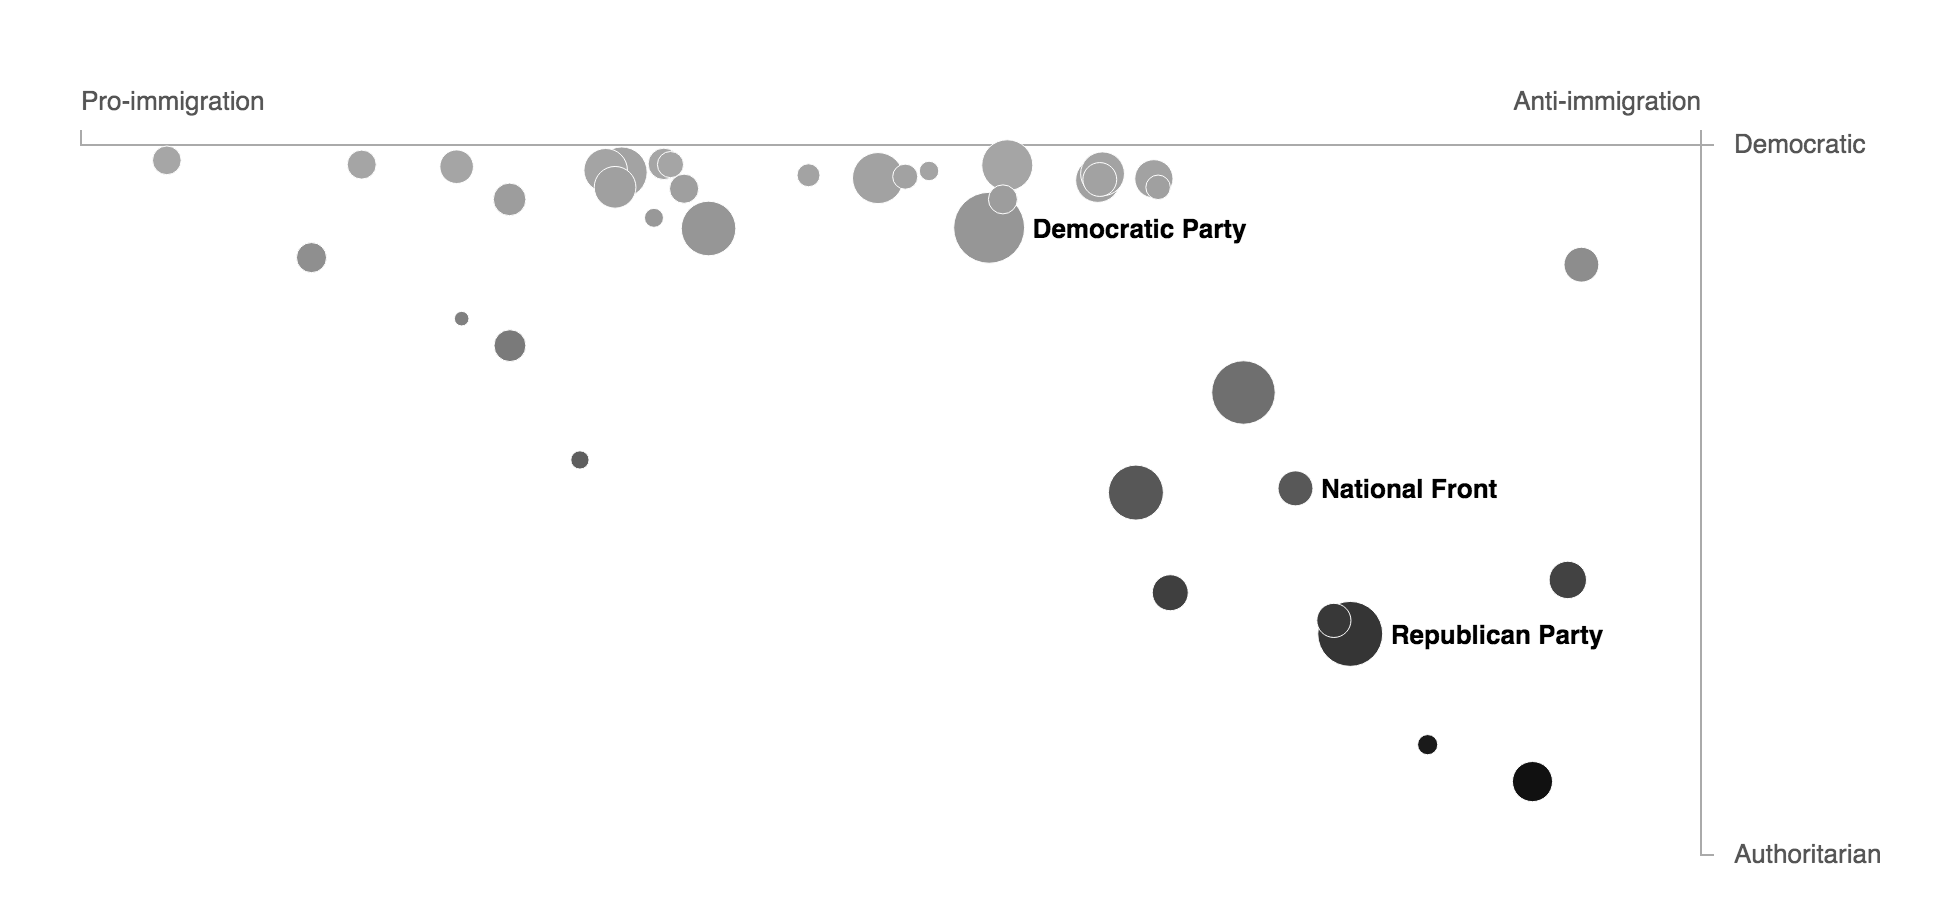
To end, the narrative returns to the overview with all political parties, transitioning to a scatterplot to show how the anti-immigration parties compare with more pro-immigration parties on views on democracy (nearly every anti-democracy party is also anti-immigration).
Process
The challenge in this project was identifying the data story. I began with a large dataset with many countries and many variables that were interesting.
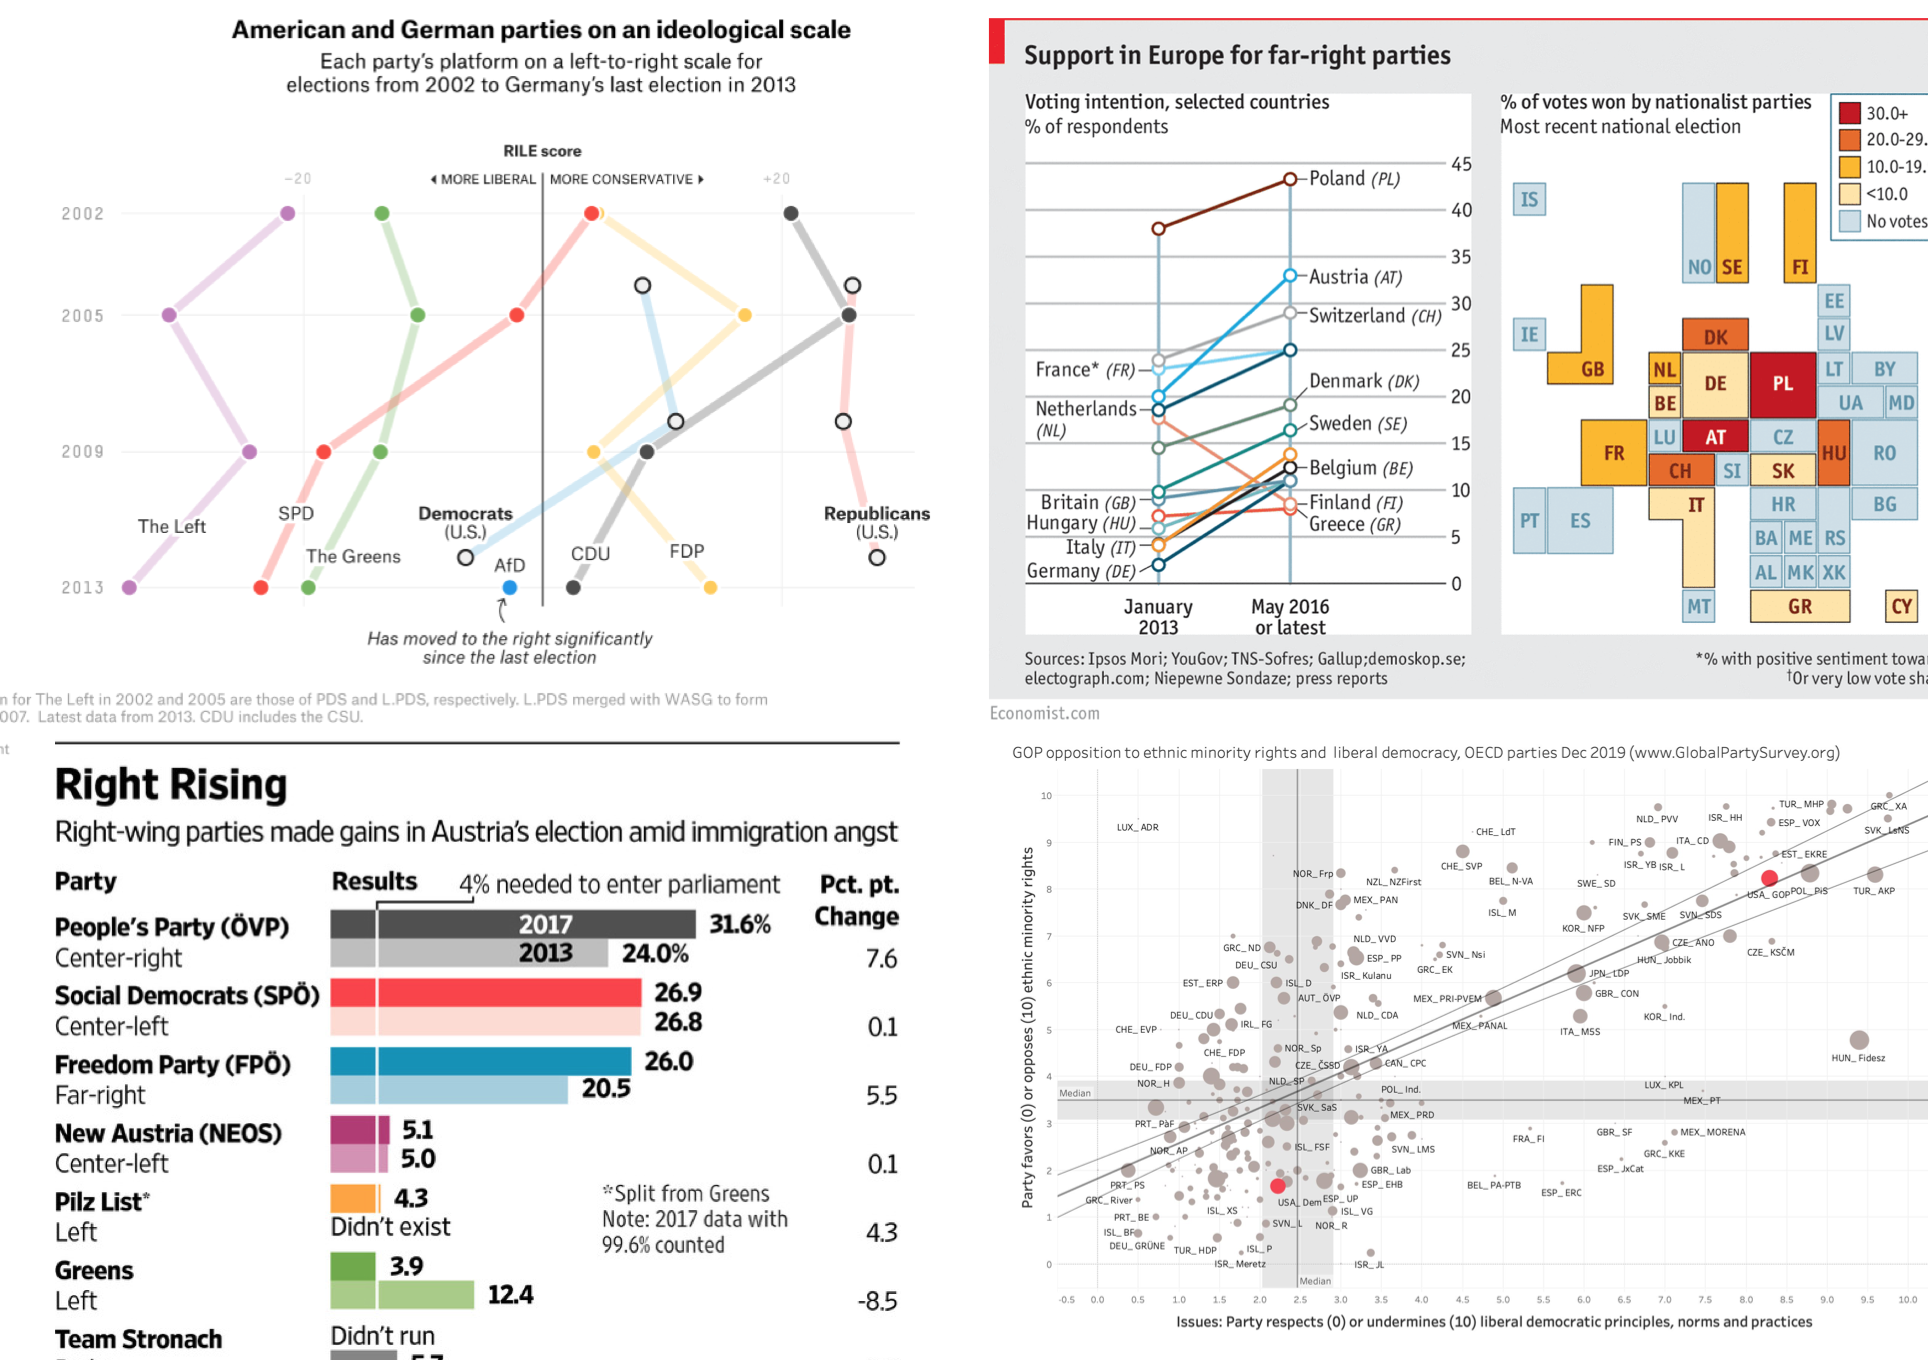
I started by looking at existing visualizations of right-wing parties for inspiration and to learn about the subject.
I then explored the data. Since I wanted to visualize several different variables, I decided to focus on a small number of parties to make it more digestible, so ultimately limited my dataset to the largest countries. I also chose to focus on anti-immigrant parties since immigration is a core part of the platform of right-wing parties, and correlated with anti-democratic views.
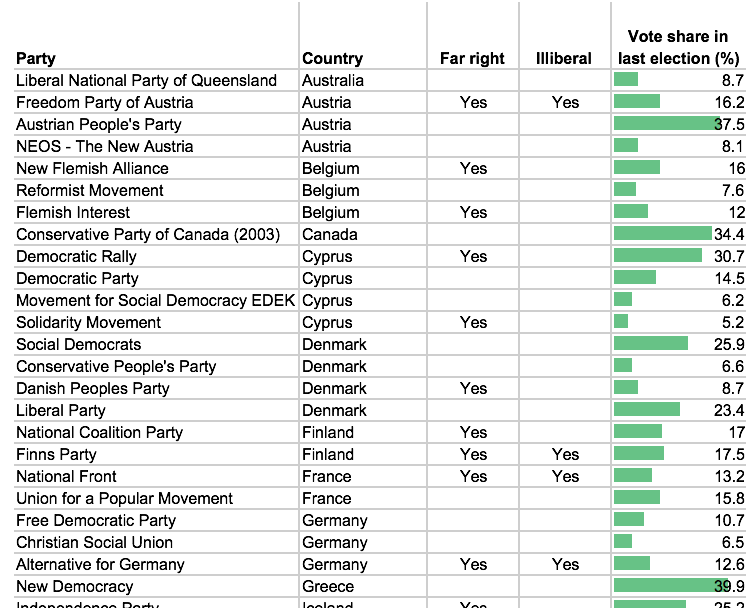
I sketched different visualization approaches before settling on the bubble approach, which worked well for transitioning between different visualizations. I prepared the data in R, which was helpful for experimenting with different groups of countries.
Future improvements could be to refactor the code and add redrawing on resize, and to update once the dataset reflects Republicans’ anti-democratic behavior around the 2020 election.