Types of Trump Voters
- Project for Data Analysis, fall 2019
- Tools used: R
- Full report: INFO_640_Final_Project.pdf
- Code: https://github.com/wmerrow/trump-voters
Analysis
This analysis uses machine learning to group Trump voters based on their political ideologies, and then looks at how many voters from each group changed their opinions of Trump over time, in order to identify what types of Trump voters are most likely to change their mind. I use survey data from the Democracy Fund Voter Study Group which contains individuals’ responses to a large number of questions asked of the same people on an annual basis.
I cluster Trump voters based on their ideology on twelve political issues, which are each a composite of multiple questions. To combine the questions, I standardize by assigning answers a value from -1 (most liberal) to 1 (most conservative) and averaging the responses.
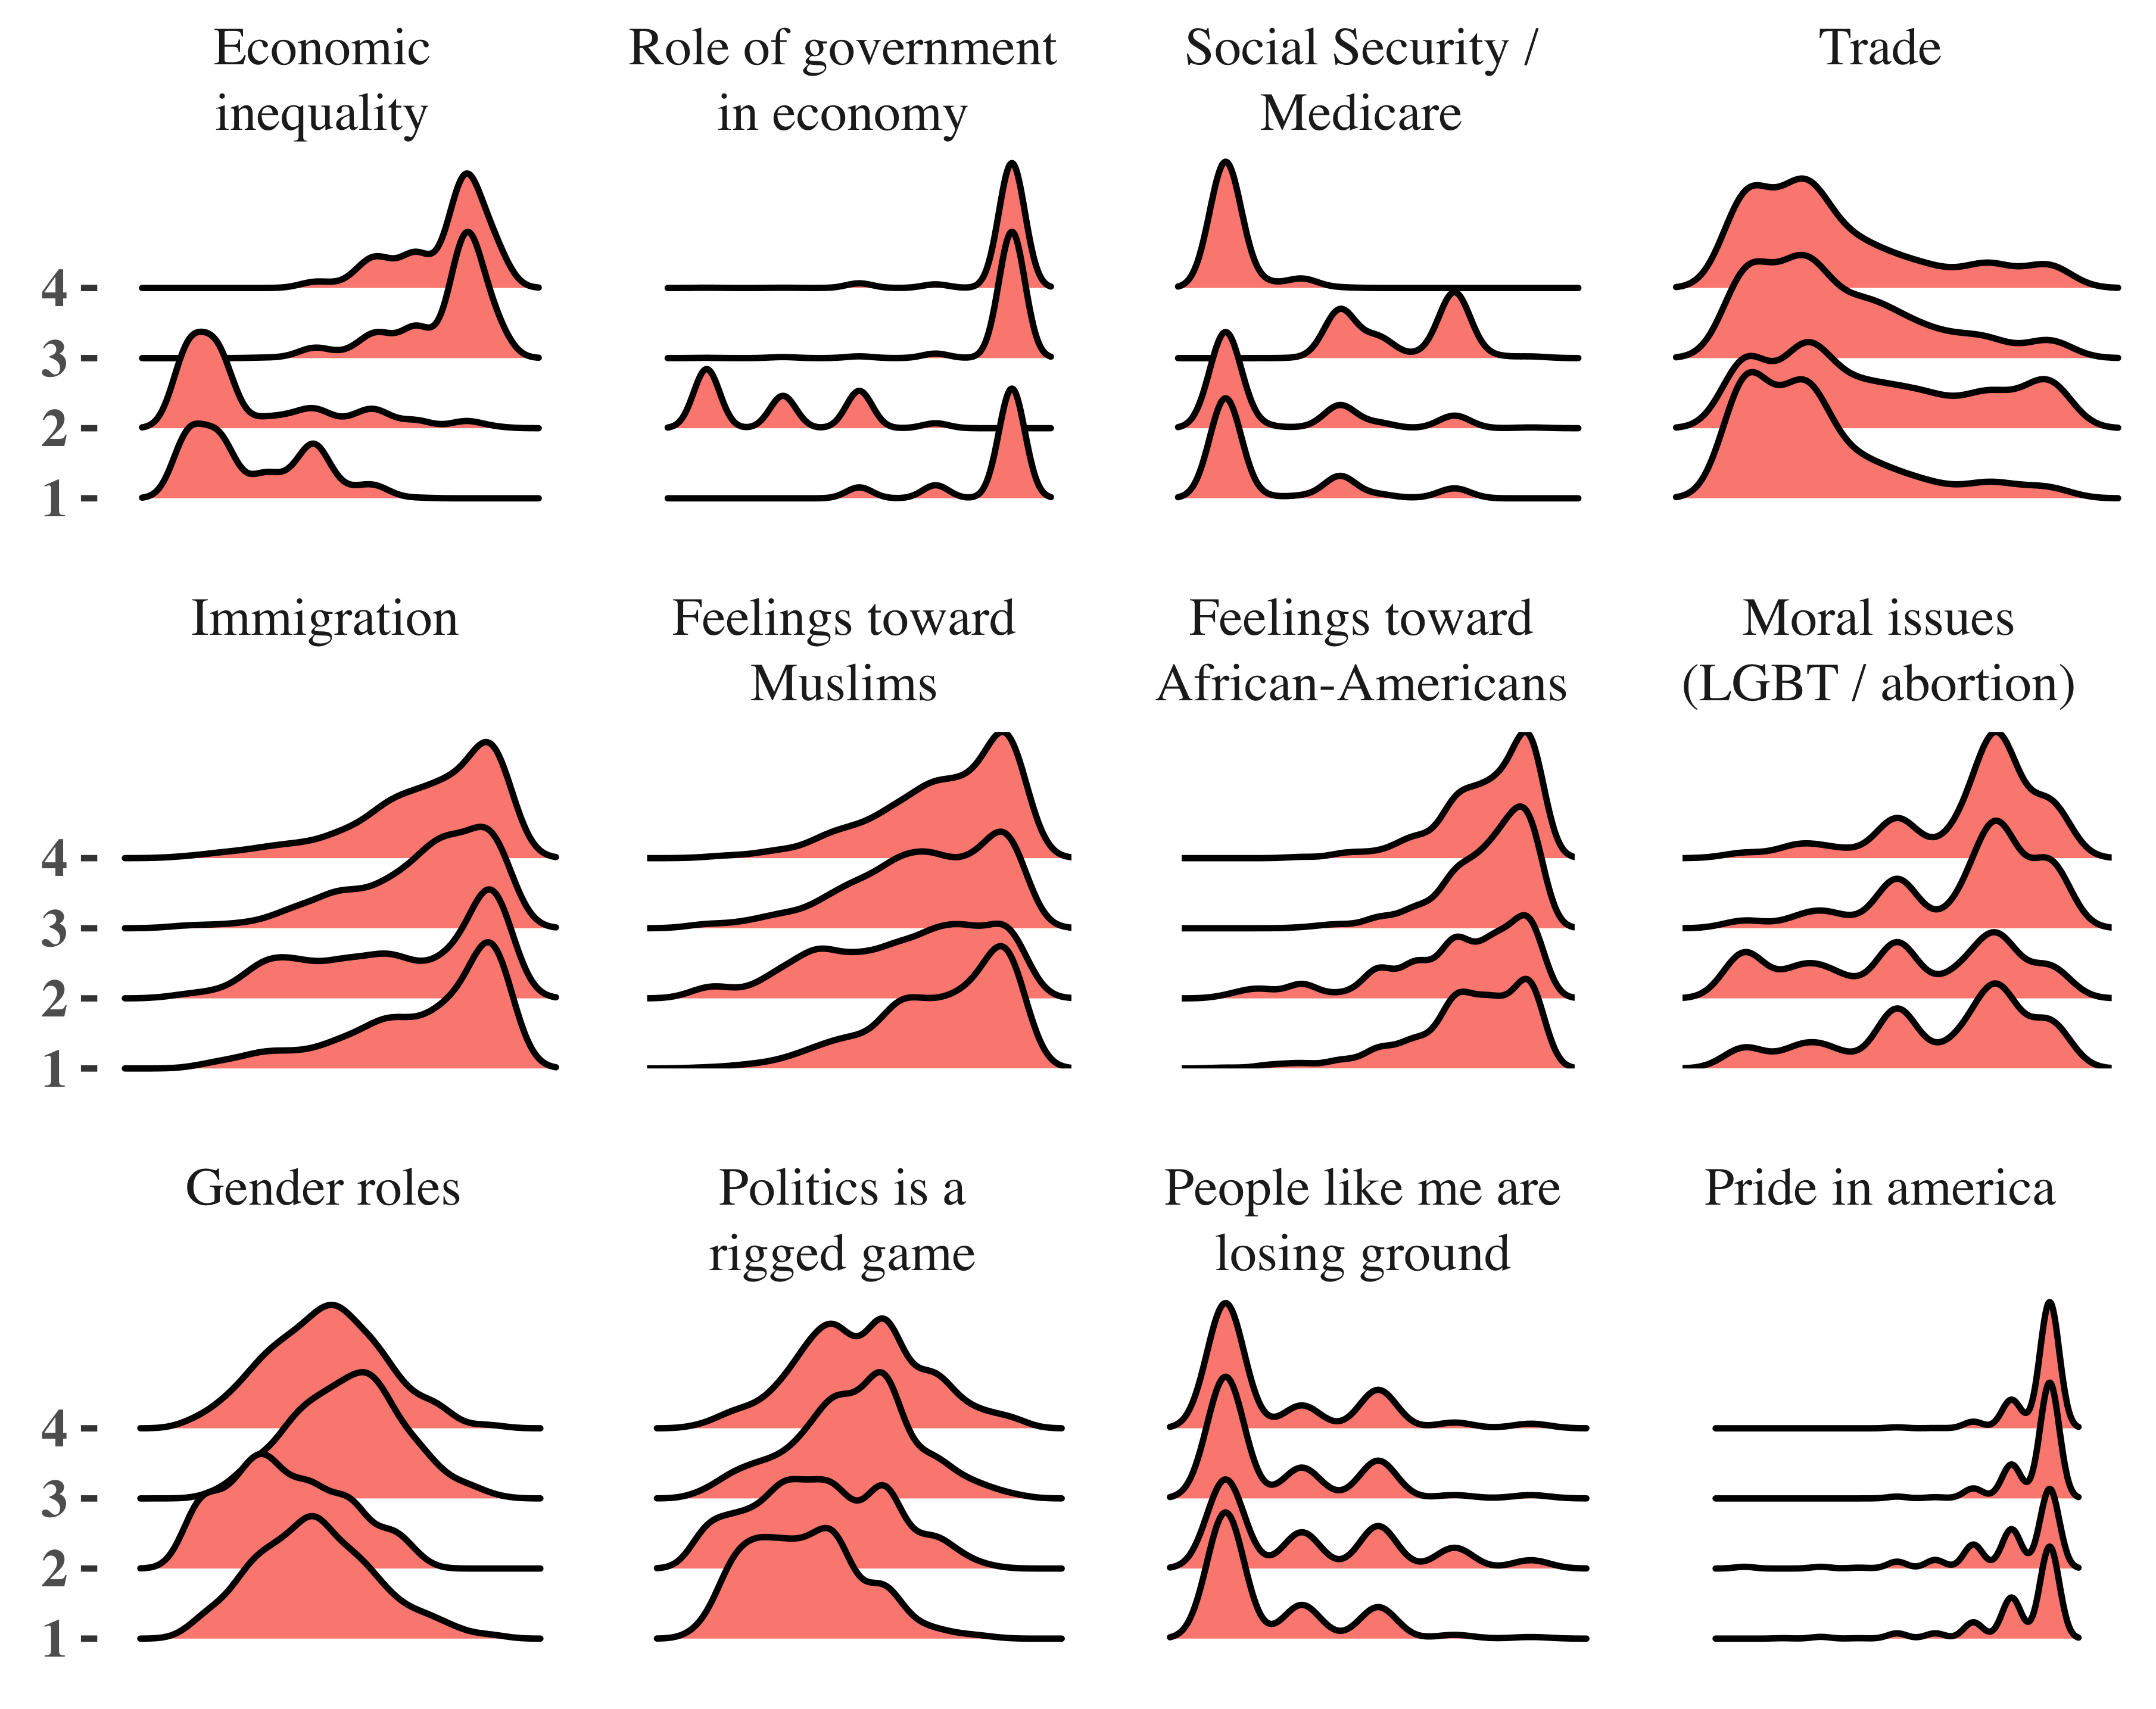
These density plots show how all Trump voters in the survey fall on a left-right spectrum for each of the twelve issues, with the x-axes representing political opinion from liberal to conservative. This shows Trump voters are consistently to the right on immigration and racial issues, but more mixed when it comes to the economy and certain social issues.

To group Trump voters by ideology, I use k means clustering with the 12 ideological variables. As we have no preconceived notion of what the ideological groups are or how many there should be, this is unsupervised machine learning. The result is four groups, as shown here. We can see that groups are primarily divided by economic issues (the top row of charts), and relatively uniform on social issues.
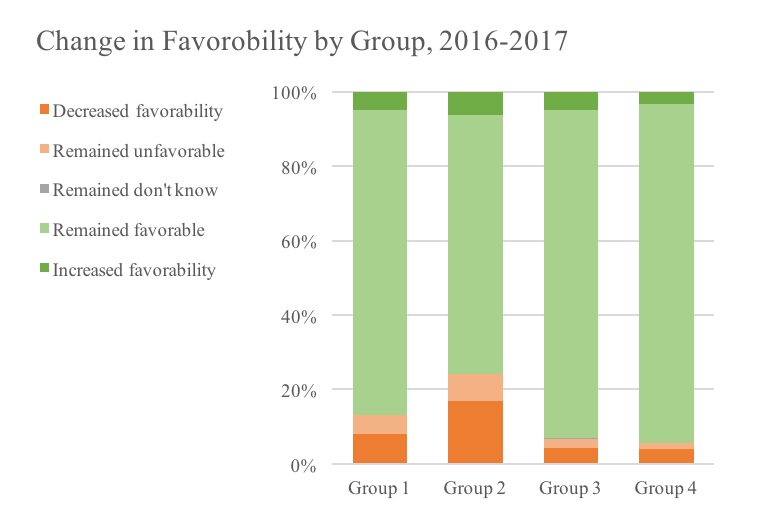
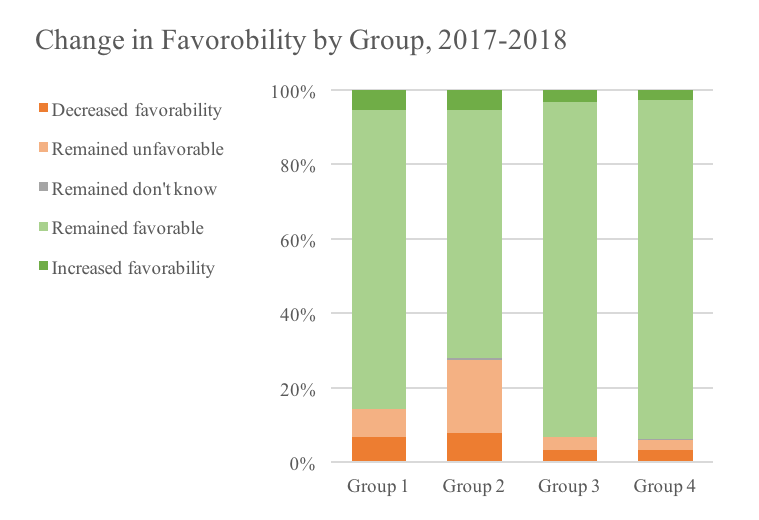
Next, we can look at the percentage of voters within each group that had positive or negative changes in favorability toward Trump from 2016 to 2017, and separately from 2017 to 2018. Voters in group 2 (the most economically liberal Trump voters) were by far the most likely to have decreased favorability toward Trump.
There are other possible ways to go about answering this research question, such as multiple regression, although clustering by ideology has two main benefits. First, it allows for a deeper understanding of the different types of Trump voters, irrespective of changes in Trump favorability. Second, it accounts for a large number of ideological variables without being prone to “noise” where a single variable happens to correlate with the dependent variable.
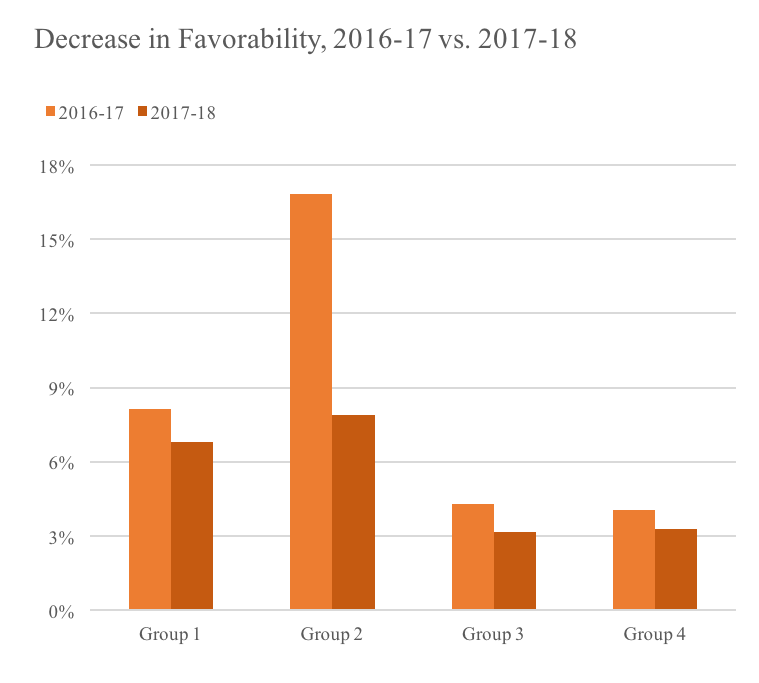
We can also see that for group 2, the decrease in favorability from 2016 to 2017 was larger than the decrease from 2017 to 2018, perhaps suggesting a realization after seeing how Trump actually governed.
The fact that we see a large difference between the time periods for group 2 but not for group 1 suggests that this “realization” in 2017 may have been a reaction to how Trump governed on the differentiating issues during his first year in office. Both groups are liberal on economic inequality, but they differ starkly in their views of the role of the government in the economy, where group 2 is far more liberal, and also differ somewhat in views on gender roles, moral issues, and immigration and racial issues, where group 2 is somewhat more moderate.
Process
I used R for the data aggregation and analysis, handling each step in its own script and referencing them from one master script.
I created the visualizations in ggplot2 and Excel.
