Council on Foreign Relations - Women's Power Index
- A project for CFR's Women and Foreign Policy program (my role: design and usability testing)
- Tools used: Sketch, Excel
The Women's Power Index is a data tool that tracks women's representation in government worldwide. The project was a team effort and involved persona development and usability testing with a prototype, with the goal of making the tool as useful as possible for our target audience.

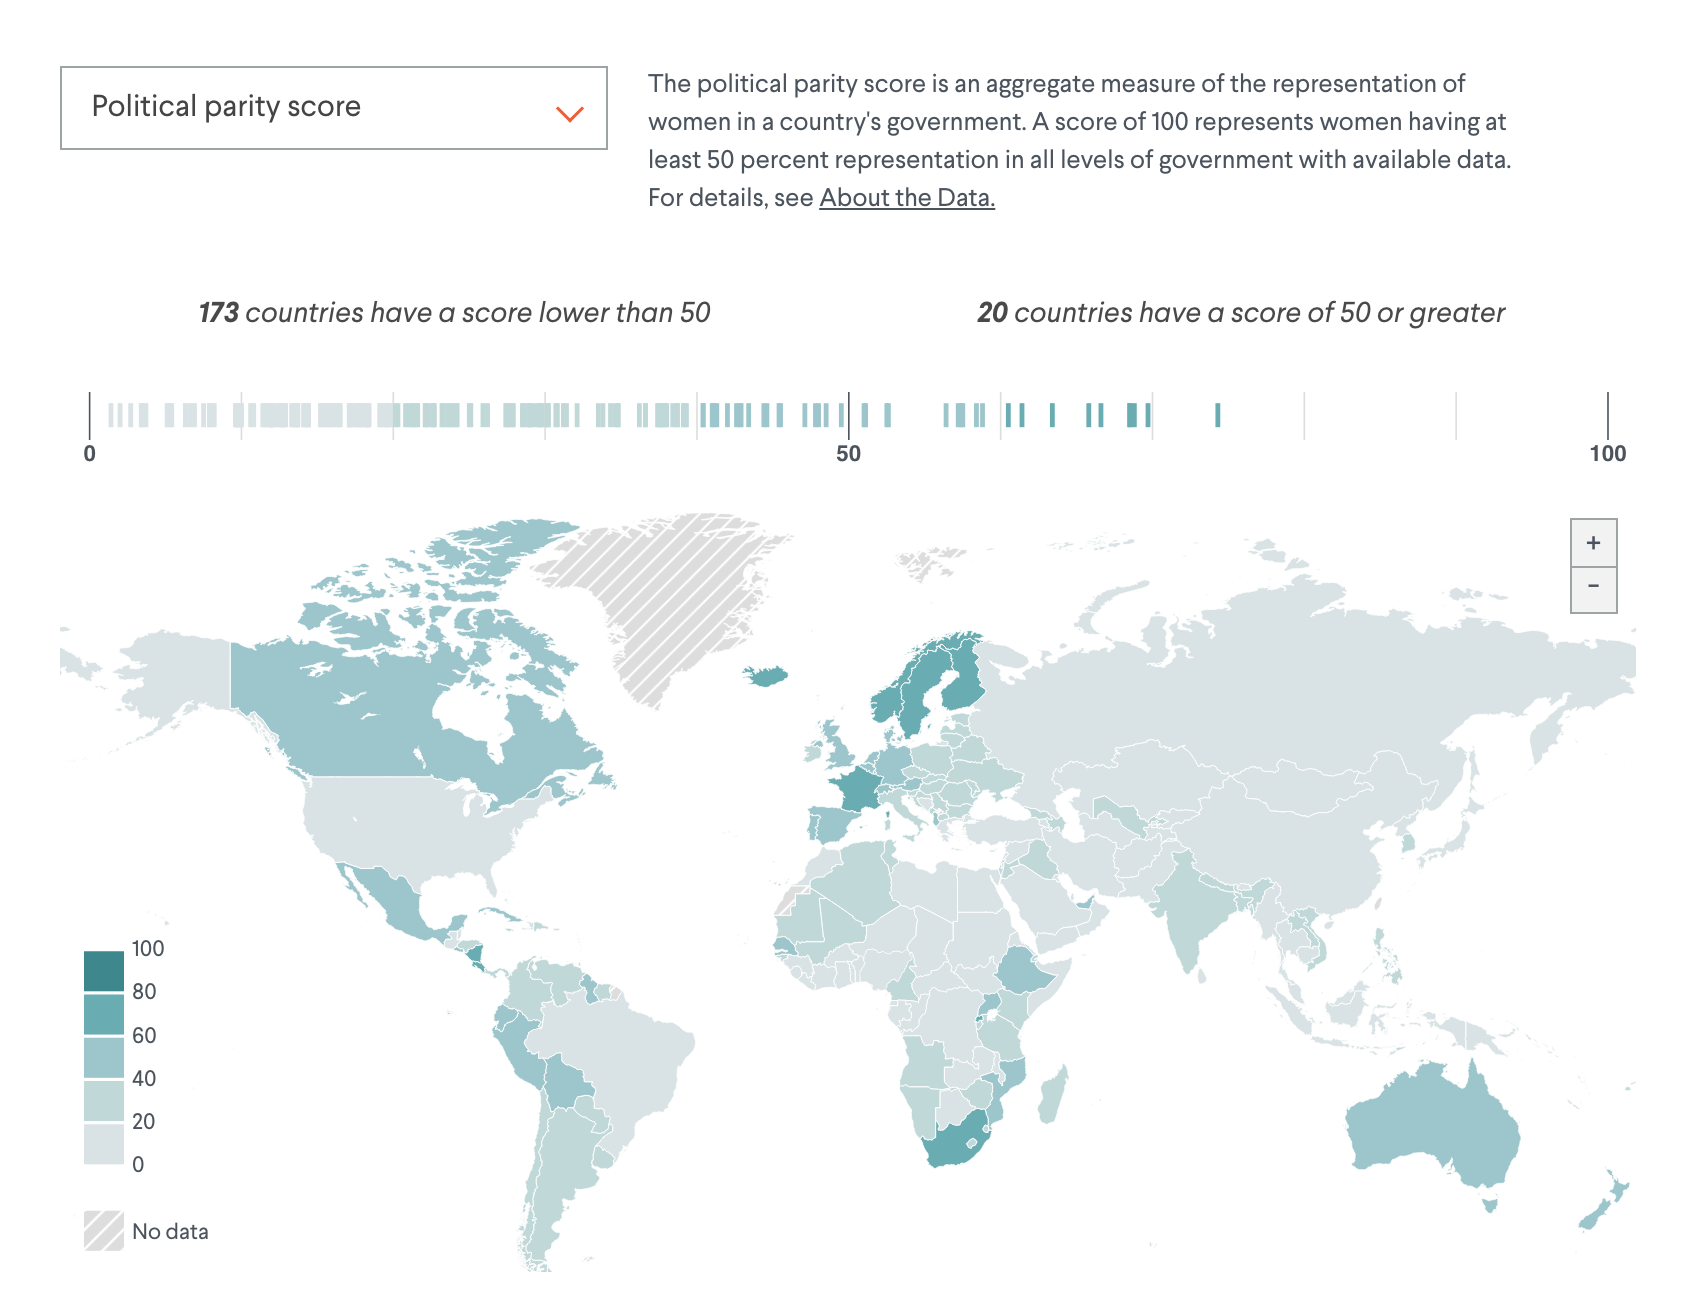
The chart and annotations above the map emphasize the distribution, highlighting how few countries have achieved parity. The chart is linked to the map on hover to show where each country ranks.
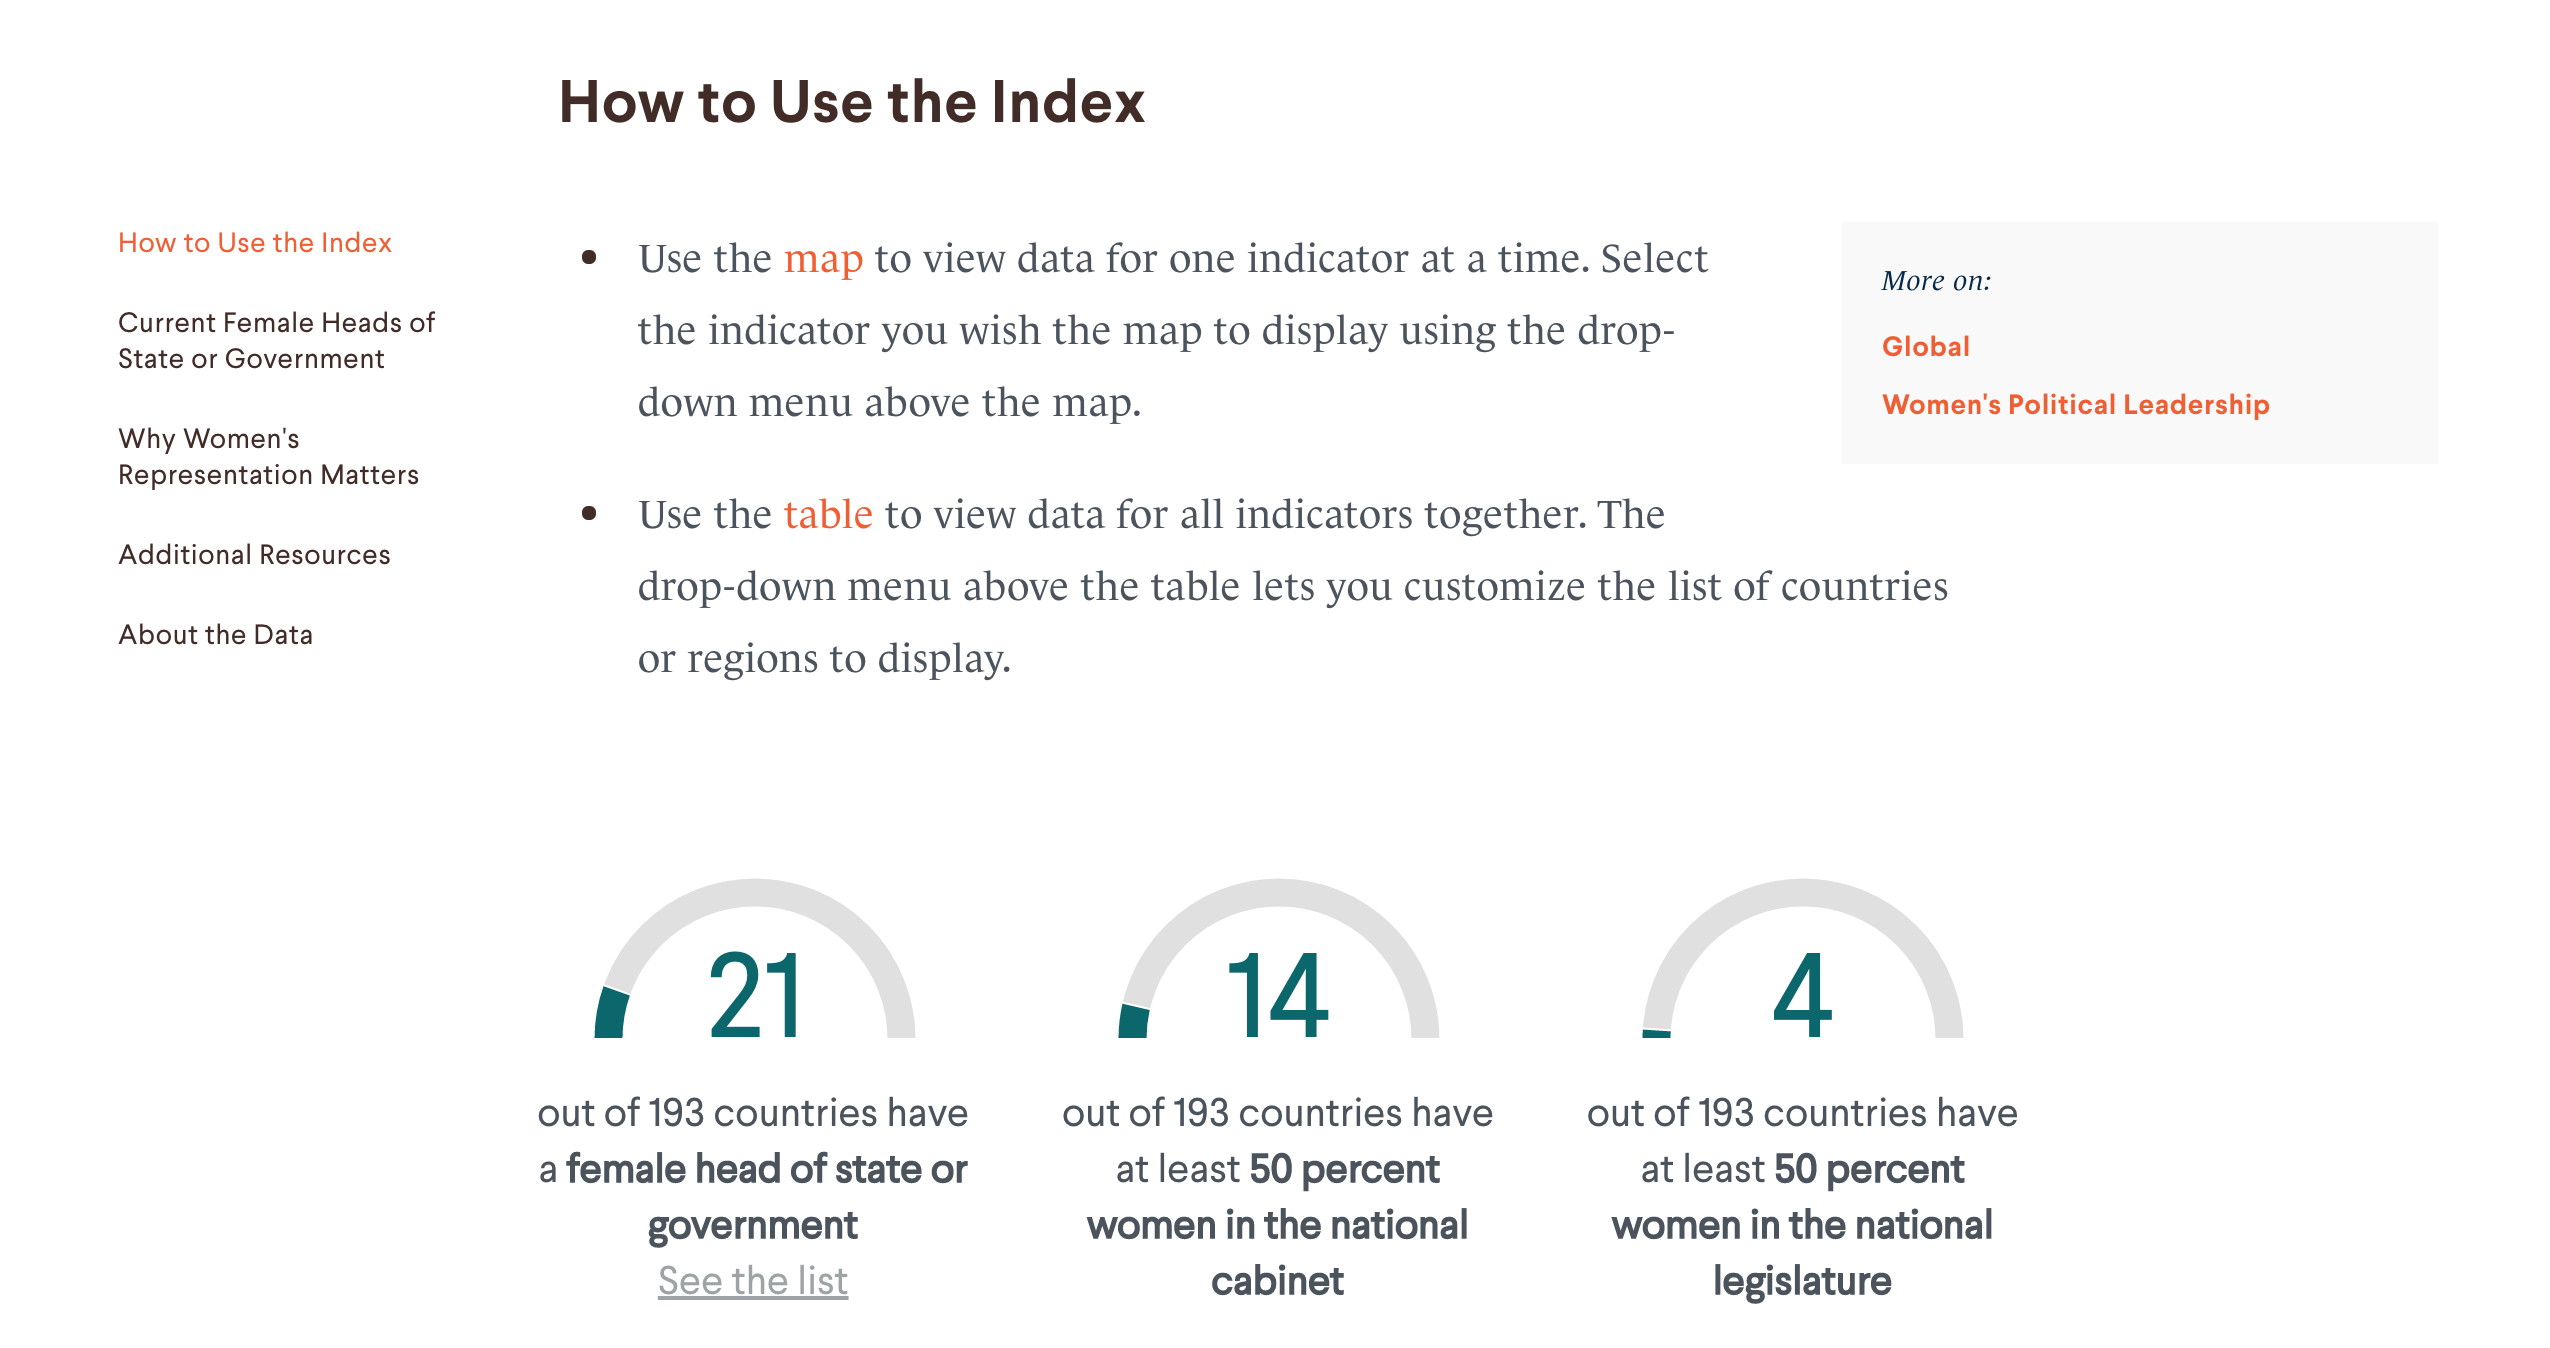
Given the presence of multiple sections with different features, we included a "How to Use the Index" section at the top, along with topline numbers to highlight the most important takeaways. This was supported by usability tests which showed some users might not be aware of the sections below.

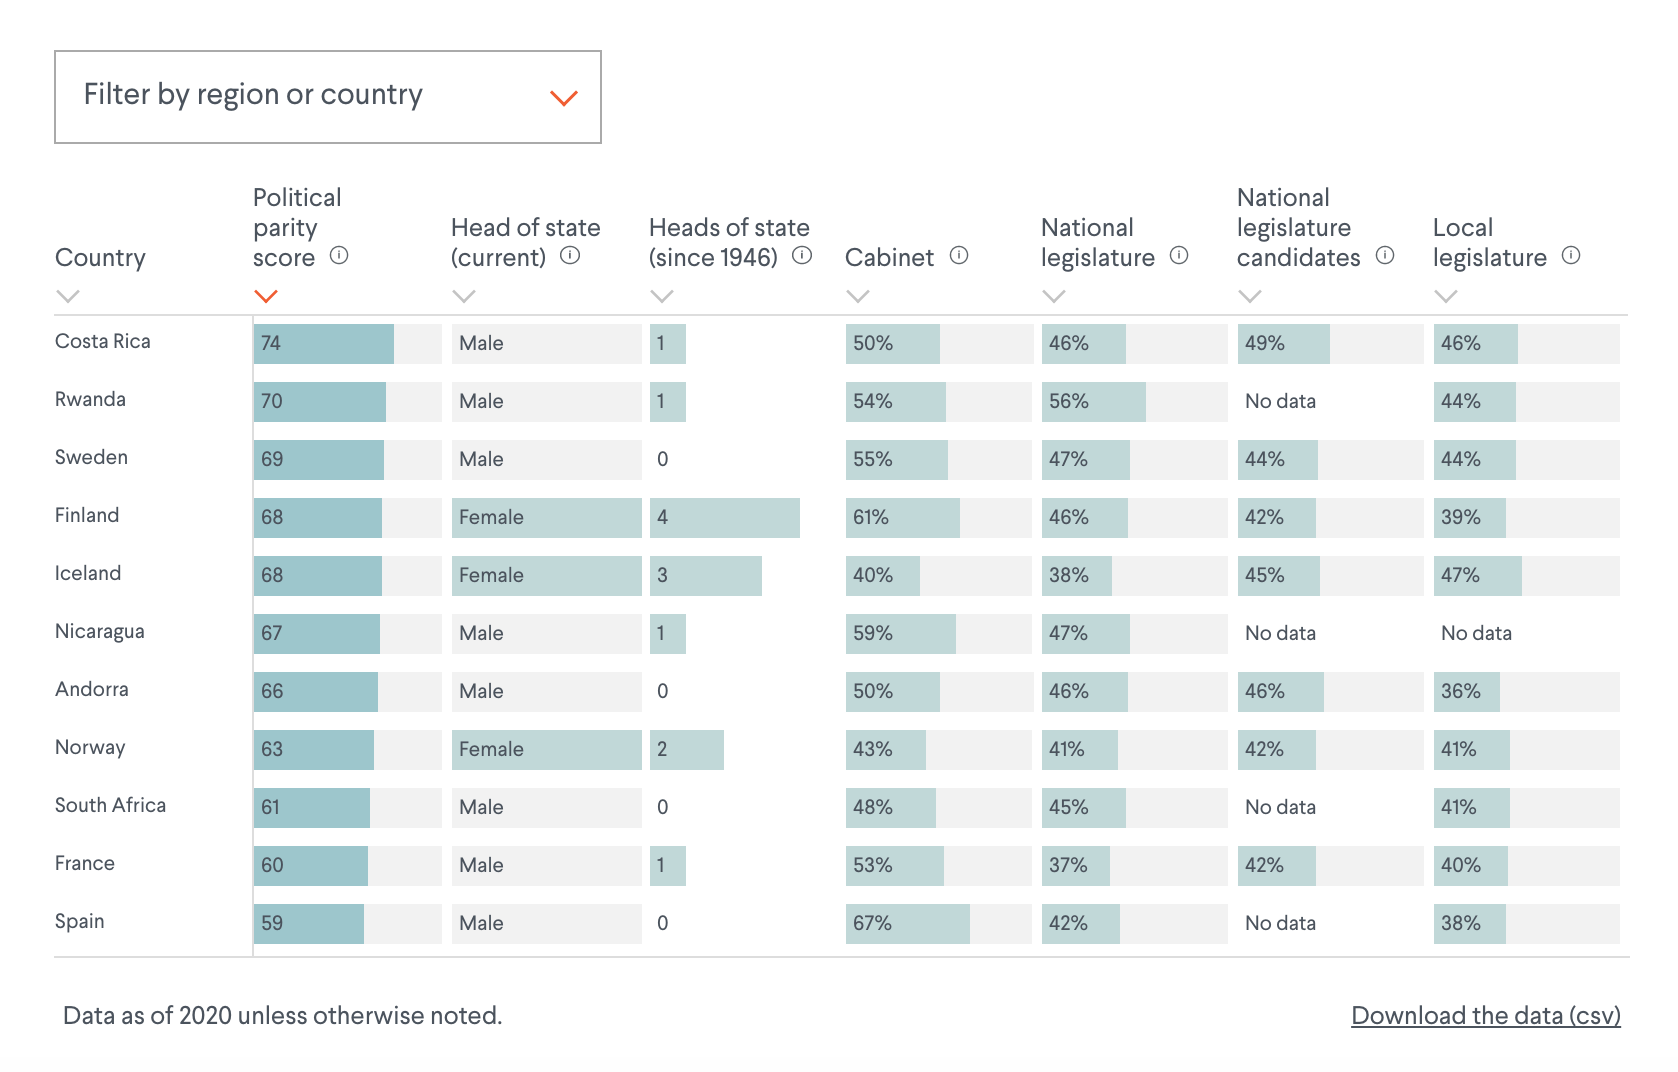
We also included a table. Although this increased the complexity of the build, our assumption based on the personas was that users would benefit from the control and detail afforded by the table.

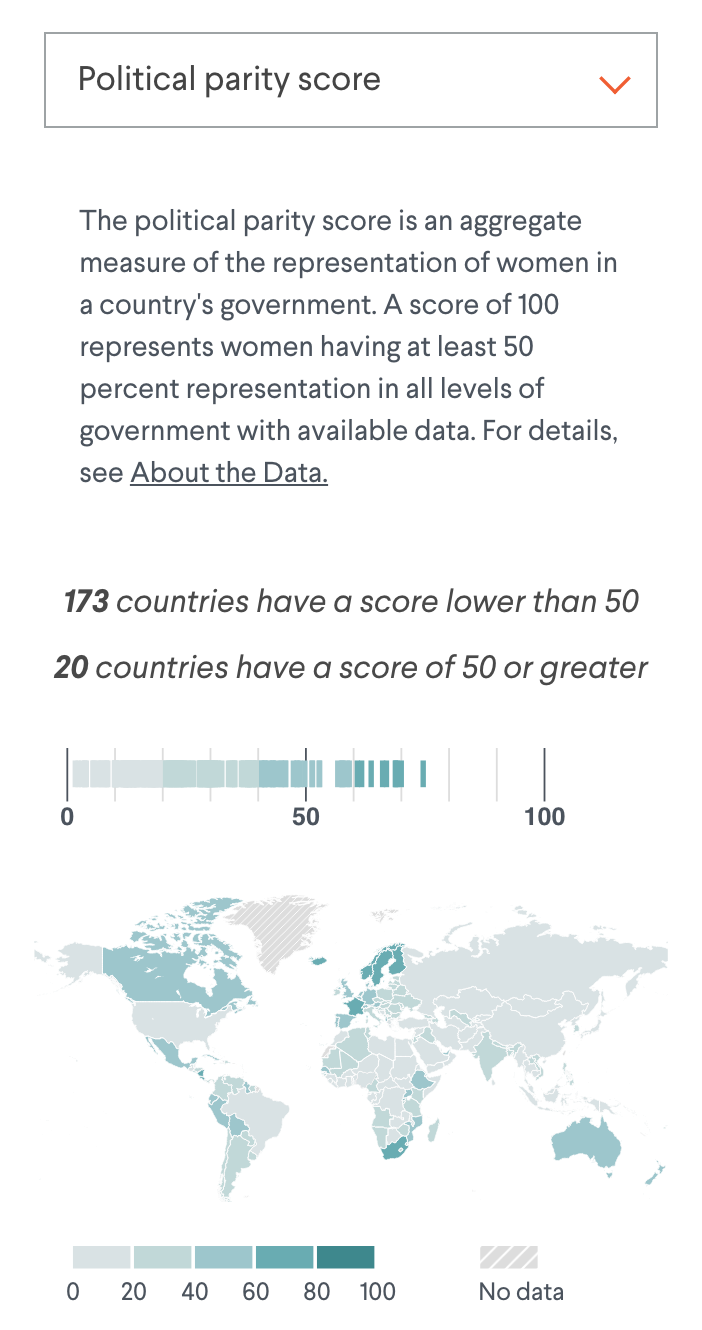
The tool is responsive, although the design prioritizes desktop based on analytics data and our user personas.
